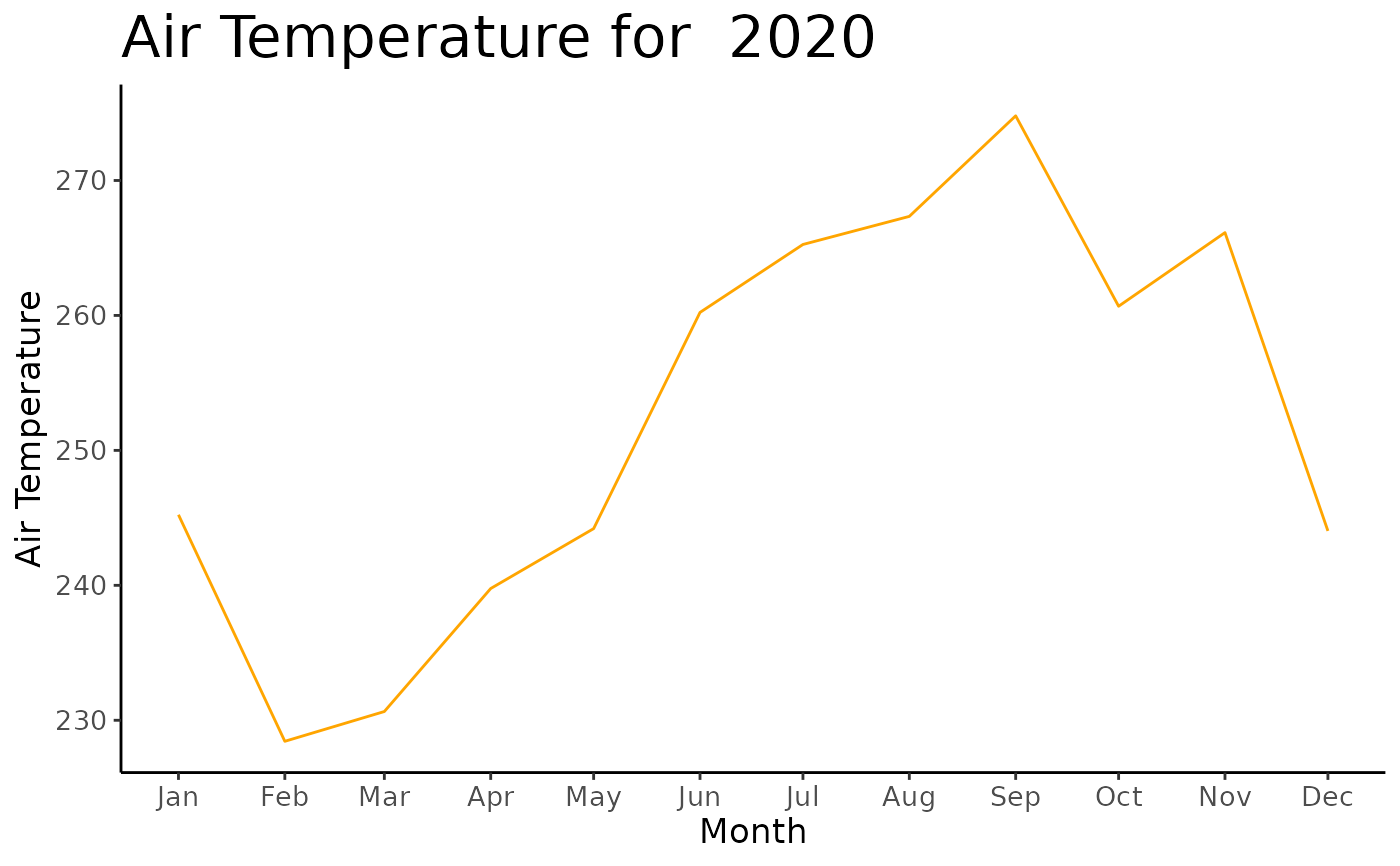
Visualizes the weather station observations including air temperature, atmospheric pressure, wind speed, and wind direction changing over time.
plot_weather_data(obs_df, col_name, time_basis)
Arguments
| obs_df | data.frame |
|---|---|
| col_name | factor |
| time_basis | factor |
Value
'ggplot2'
Examples
weather_df <- get_weather_data("911650-22536", 2020)
plot_weather_data(obs_df = weather_df, col_name = "air_temp", time_basis = "monthly")