Installation
You can install the development version of this package from Github with:
install.packages("devtools")
devtools::install_github("UBC-MDS/noaastnr")Usage
Typical usage will begin with downloading the list of available weather stations in the country of interest using the get_stations_info() function. A dataframe is returned which can be reviewed to find a suitable station in the area of interest. Alternatively, the NOAA provides a graphical interface for exploring the available weather stations.
get_stations_info(country = "US")
#> # A tibble: 7,158 x 11
#>    usaf   wban  station_name    country state call  latitude longitude elevation
#>    <chr>  <chr> <chr>           <chr>   <chr> <chr> <chr>    <chr>     <chr>
#>  1 621010 99999 MOORED BUOY     US      <NA>  <NA>  +50.600  -002.933  -0999.0
#>  2 621110 99999 MOORED BUOY     US      <NA>  <NA>  +58.900  -000.200  -0999.0
#>  3 621130 99999 MOORED BUOY     US      <NA>  <NA>  +58.400  +000.300  -0999.0
#>  4 621160 99999 MOORED BUOY     US      <NA>  <NA>  +58.100  +001.800  -0999.0
#>  5 621170 99999 MOORED BUOY     US      <NA>  <NA>  +57.900  +000.100  -0999.0
#>  6 621220 99999 MOORED BUOY     US      <NA>  <NA>  +56.500  +002.017  -0999.0
#>  7 621250 99999 MOORED BUOY     US      <NA>  <NA>  +53.800  -003.800  -0999.0
#>  8 621260 99999 MOORED BUOY     US      <NA>  <NA>  +53.800  -003.600  -0999.0
#>  9 621300 99999 MOORED BUOY     US      <NA>  <NA>  +53.000  +001.700  -0999.0
#> 10 621370 99999 PLATFORM NO. 6… US      <NA>  <NA>  +57.350  +001.467  +0000.0
#> # … with 7,148 more rows, and 2 more variables: start <dttm>, end <dttm>
After selecting a weather station number, the get_weather_data() function can be used to download various weather parameters for the station number and year of interest. The following usage example downloads weather data from station number “911650-22536” for the year 2020 and saves the data to a variable called ‘weather_data’. ‘weather_data’ will be a data frame containing a time series of the following parameters for the station and year of interest:
- air temperature (degrees Celsius)
- atmospheric pressure (hectopascals)
- wind speed (m/s)
- wind direction (angular degrees)
weather_data <- get_weather_data("911650-22536", 2020)
weather_data
#> # A tibble: 16,211 x 6
#>    stn          datetime            air_temp atm_press wind_spd wind_dir
#>    <chr>        <dttm>                 <dbl>     <dbl>    <dbl>    <dbl>
#>  1 911650-22536 2020-01-01 00:00:00      261     1019.      7.2       90
#>  2 911650-22536 2020-01-01 00:53:00      272     1019.      6.7       80
#>  3 911650-22536 2020-01-01 01:51:00      260       NA       6.7       80
#>  4 911650-22536 2020-01-01 01:53:00      261     1019.      7.7       80
#>  5 911650-22536 2020-01-01 02:51:00      260       NA       7.7       90
#>  6 911650-22536 2020-01-01 02:53:00      256     1019.      7.7       90
#>  7 911650-22536 2020-01-01 03:53:00      256     1019.      8.2       80
#>  8 911650-22536 2020-01-01 04:53:00      250     1020.      8.8      100
#>  9 911650-22536 2020-01-01 05:53:00      250     1020.      9.3       90
#> 10 911650-22536 2020-01-01 06:00:00      250     1020.      9.3       90
#> # … with 16,201 more rows
The function plot_weather_data() can be used to visualize a time series of any of the available weather parameters either on a mean daily or mean monthly basis. The function returns an Altair chart object which can be saved or displayed in any environment which can render Altair objects.
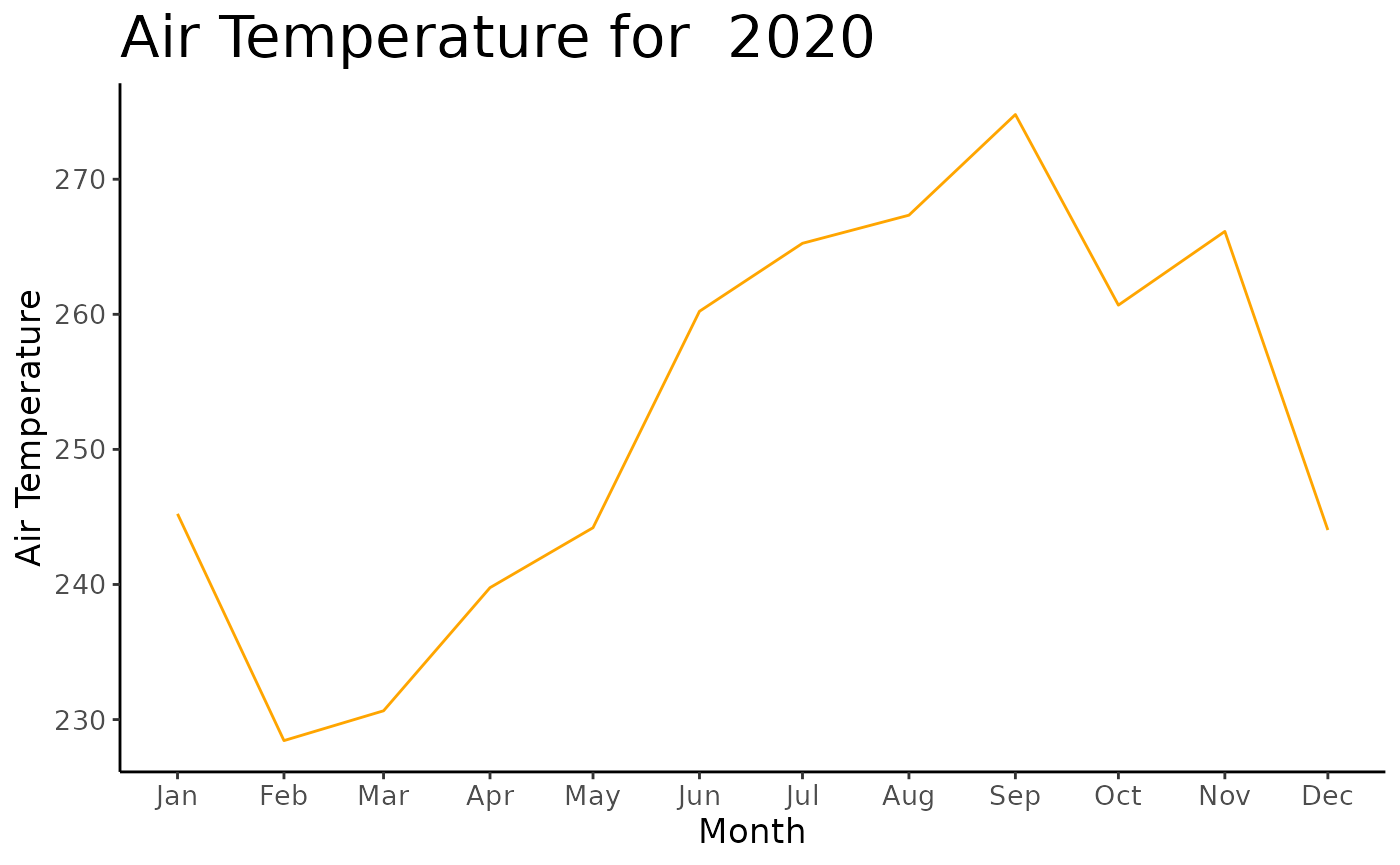
# weather_data <- get_weather_data("911650-22536", 2020)
plot_weather_data(weather_data, col_name="air_temp", time_basis="monthly")