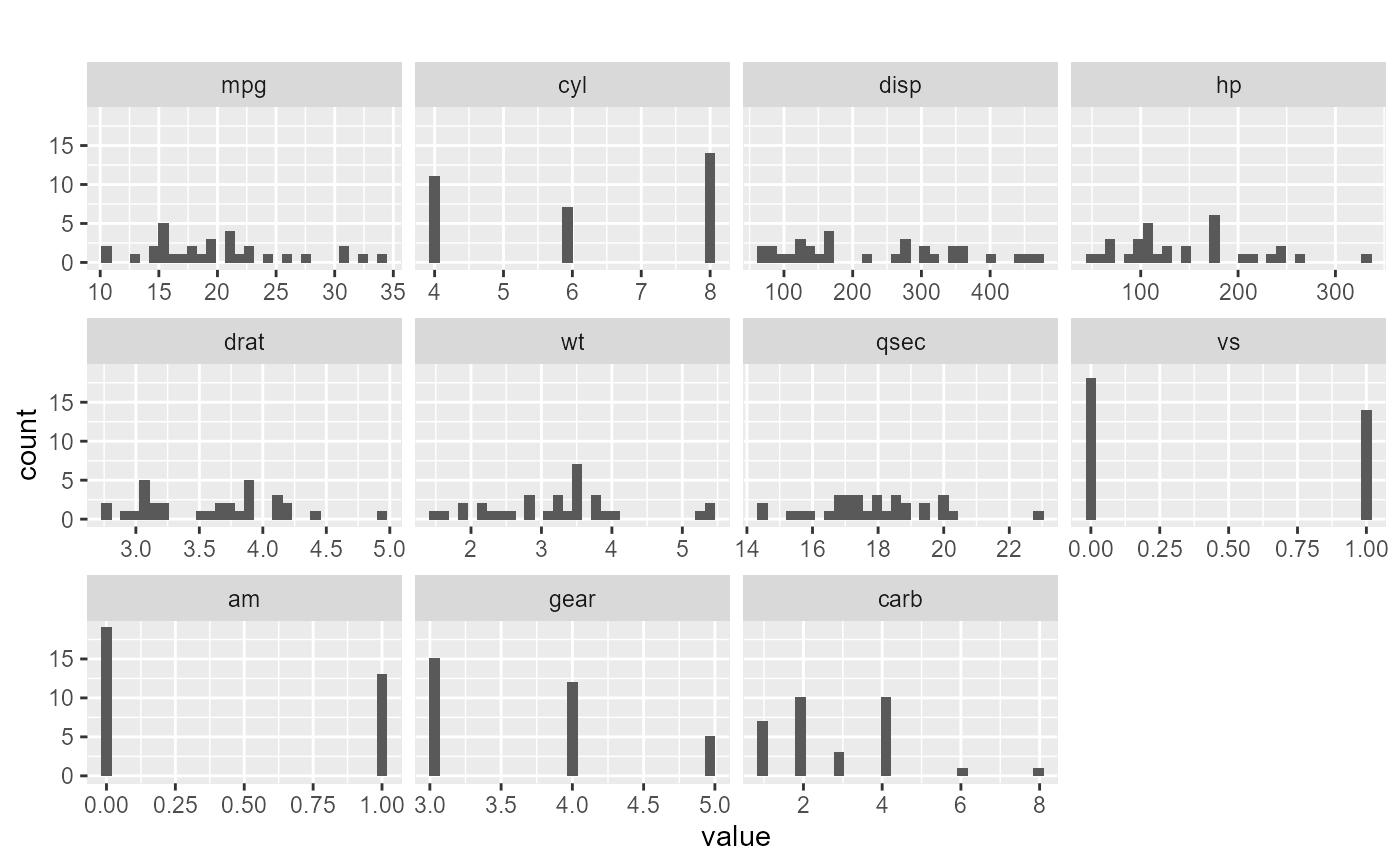
plot histograms for all numerical columns in the given data frame.
plot_hist(input_df, density = FALSE, exclude = c(NA), title = "")
Arguments
| input_df | The input dataframe |
|---|---|
| density | The boolean indicating whether or not to plot the density. |
| exclude | The columns not to include in the output. |
| title | The title of the histograms |
Value
ggplot2 object
Examples
plot_hist(mtcars)#>#>