Introduction
The goal of ploteasyr is to let beginners of R have a swift plotting trip!
plot_bar
The function is to plot bars for all numerical columns in the given dataframe.
plot_bar(mtcars)
plot_hist
The function is to plot histograms for all numerical columns in the given dataframe.
plot_hist(mtcars)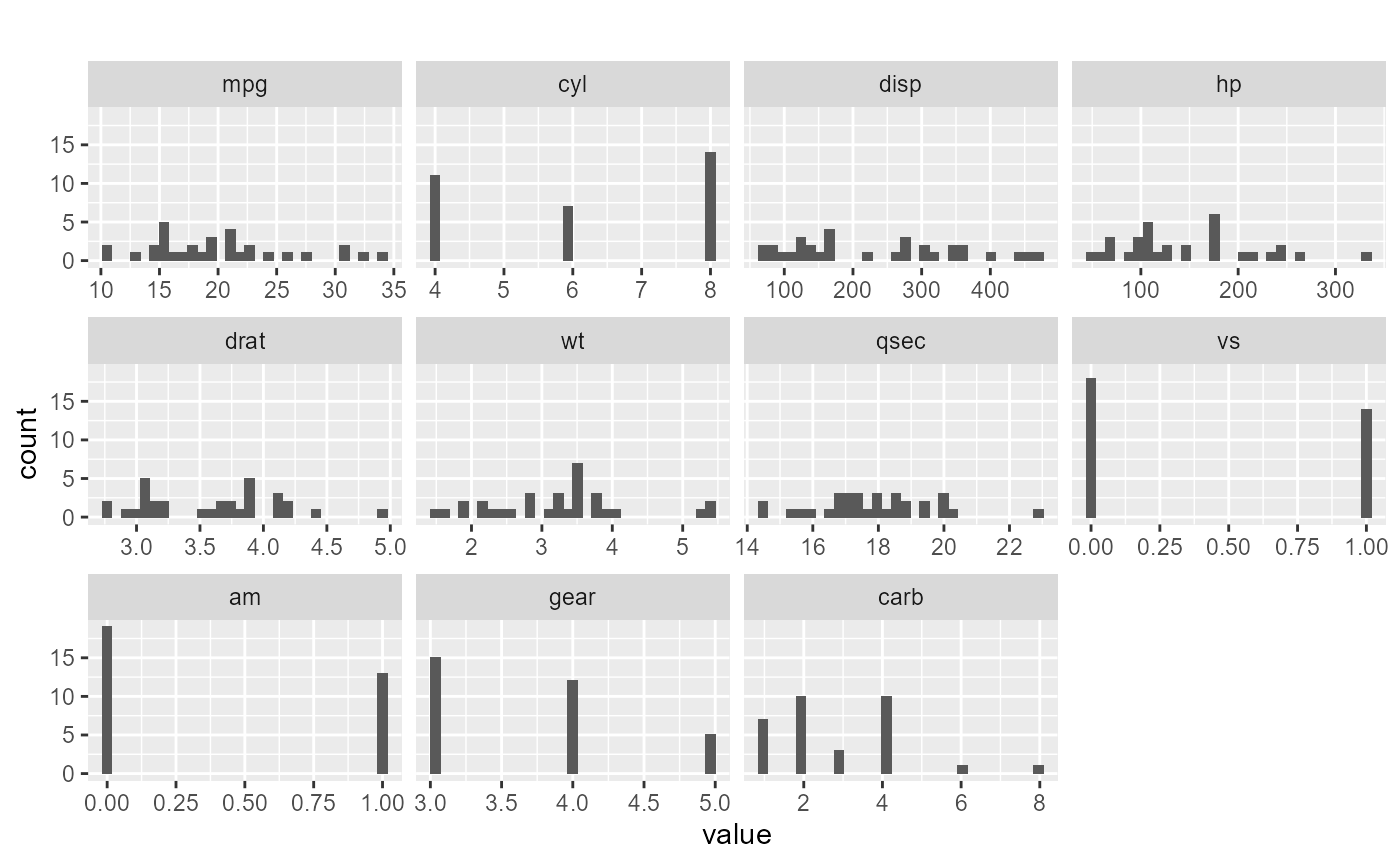
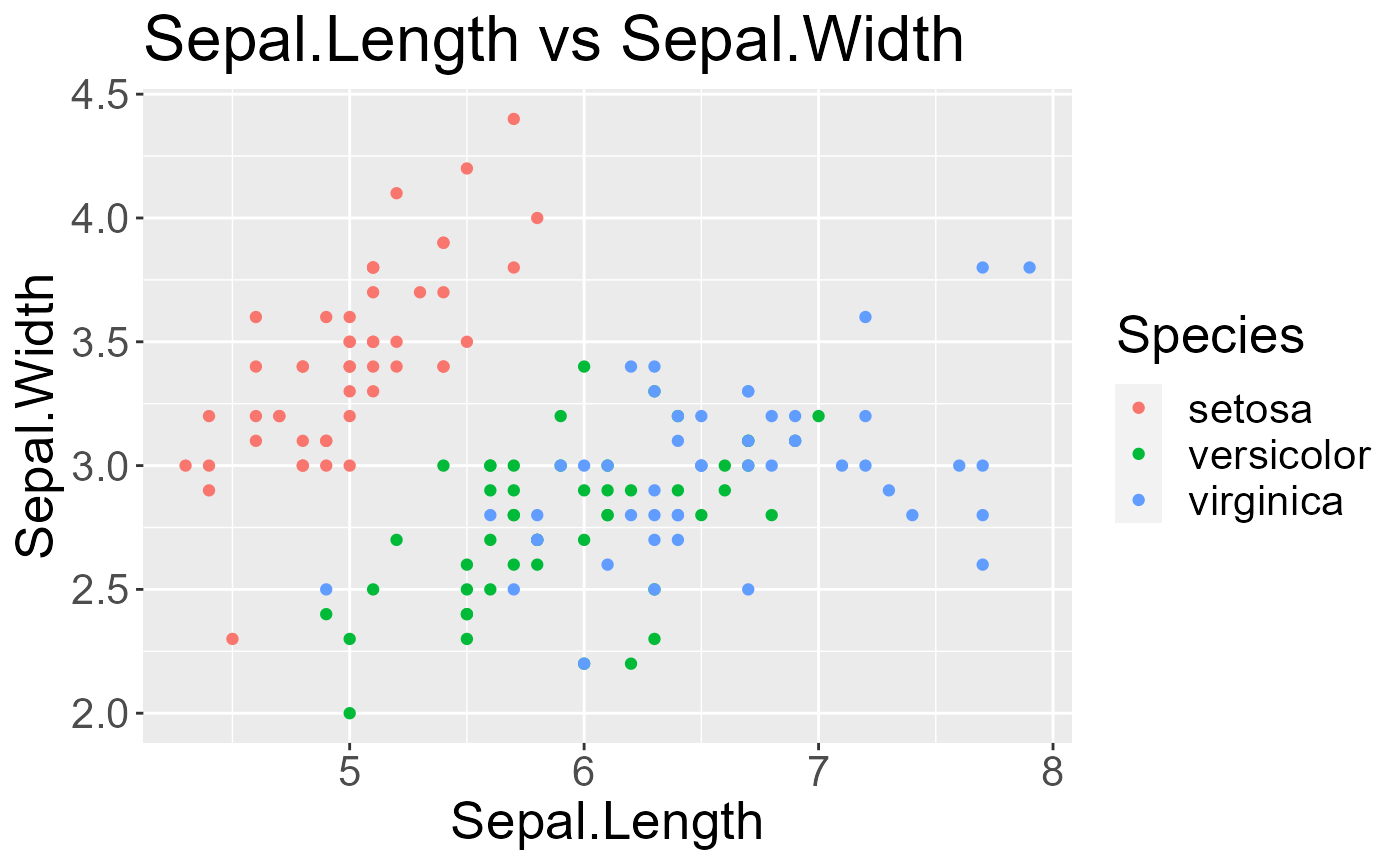
plot_scatter
The function is to take a dataframe and returns a scatterplot of chosen numeric features in the dataset
plot_scatter(iris, xcol = Sepal.Length, ycol = Sepal.Width,
color = Species, title = "Sepal.Length vs Sepal.Width", size = 20)