Takes a dataframe and returns a scatterplot of chosen numeric features in the dataset
plot_scatter(data, xcol, ycol, color, title = NULL, size = 20)
Arguments
| data | A data frame or a tibble. |
|---|---|
| xcol | A numerical column . |
| ycol | A numerical column. |
| color | A categorical column. |
| title | An optional character variable spefified by users. |
| size | An optional integer variable spefified by users for the text size of all labels. |
Value
A scatter plot.
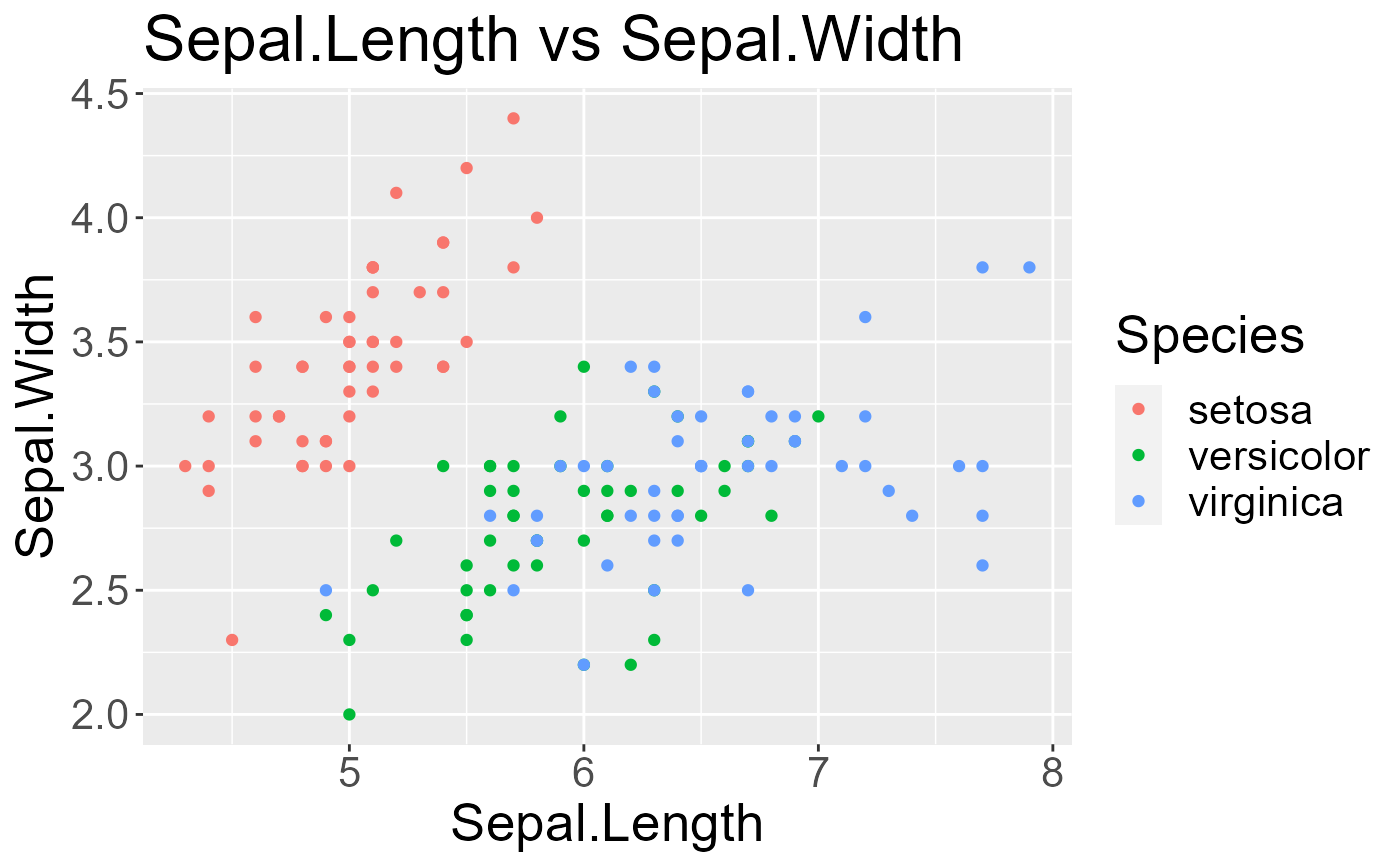
Examples
plot_scatter(iris, xcol = Sepal.Length, ycol = Sepal.Width,
color = Species, title = "Sepal.Length vs Sepal.Width", size = 20)