visualize_outliers.Rd
A function that plot out the given data with outliers marked.
visualize_outliers(dataframe, columns = NULL, type = "violin")
A target dataframe where the function is performed.
The target columns where the function needed to be performed. Default is None, the function will check all columns.
The method of plotting the distribution.
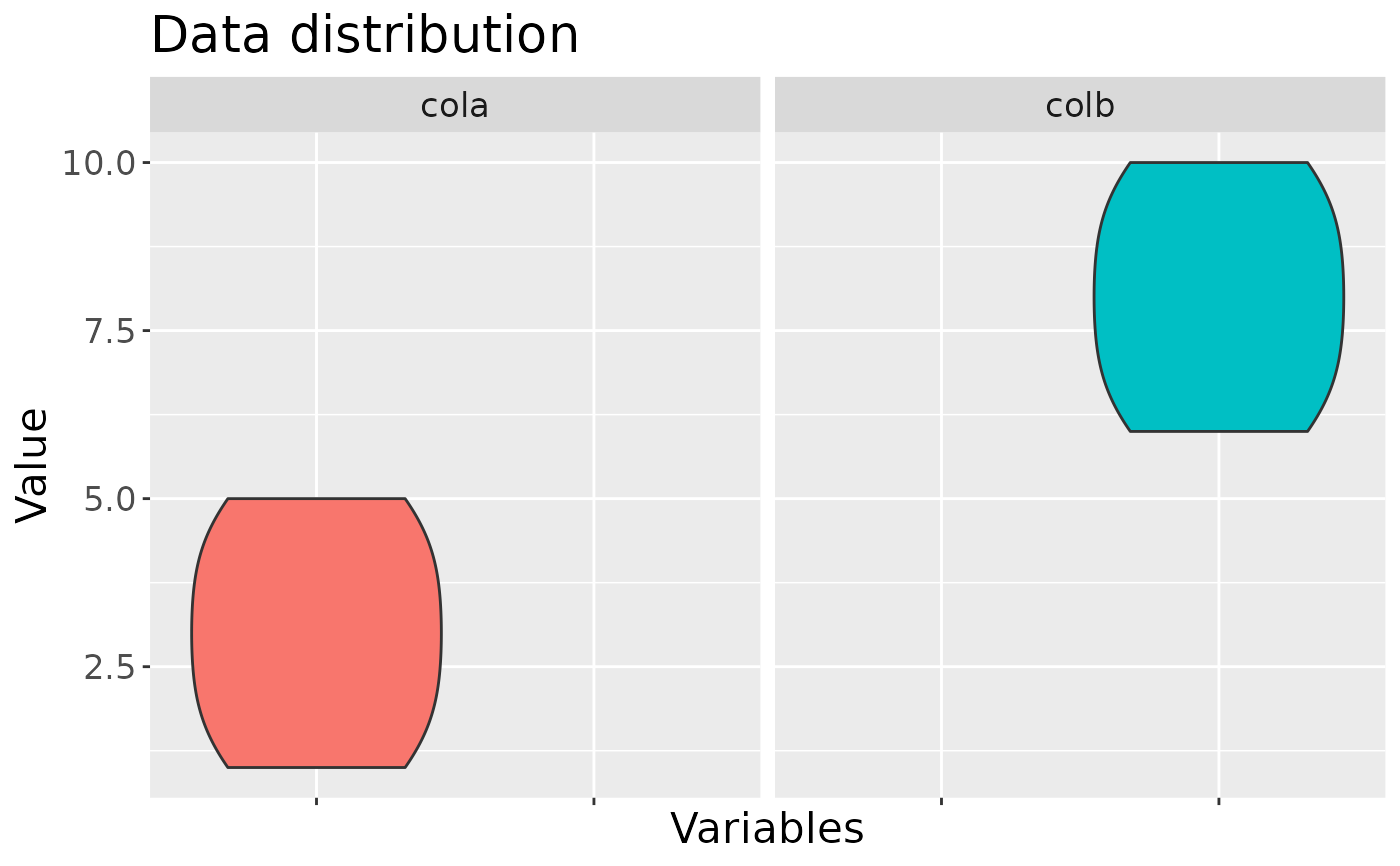
A ggplot of data distribution.
library(tidyverse)
library(ggplot2)

df <- tibble(cola=c(1:5), colb=c(6:10), colc=c(11:15))
visualize_outliers(df, columns=c("cola", "colb"), type="violin")