How to use routlierutils
Karanpreet Kaur, Linhan Cai, Qingqing Song
my-vignette.RmdHere we will demonstrate how to use py_outliers_utils to deal with the outliers in a dataset and plot the distribution of the dataset:
Create a dataframe
We need to create a dataframe to work with.
df <- data.frame(SepalLengthCm = c(5.1, 4.9, 4.7, 5.5, 5.1, 10, 54, 5.0, 5.2, 5.3, 5.1),
                          SepalWidthCm = c(1.4, 1.4, 10, 2.0, 0.7, 1.6, 1.2, 1.4, 1.8, 1.5, 2.1),
                          PetalWidthCm = c(0.2, 0.2, 0.2, 0.3, 0.4, 0.5, 0.5, 0.6, 0.4, 0.2, 5))
df
#>    SepalLengthCm SepalWidthCm PetalWidthCm
#> 1            5.1          1.4          0.2
#> 2            4.9          1.4          0.2
#> 3            4.7         10.0          0.2
#> 4            5.5          2.0          0.3
#> 5            5.1          0.7          0.4
#> 6           10.0          1.6          0.5
#> 7           54.0          1.2          0.5
#> 8            5.0          1.4          0.6
#> 9            5.2          1.8          0.4
#> 10           5.3          1.5          0.2
#> 11           5.1          2.1          5.0
Identify outliers
We can identify outliers using outlier_identifier. Note that this function will return a dataframe with the summary of the outlier identified by the method, with an additional column having if row has outlier or not if return_df = True.
outlier_identifier(df, columns=c('SepalWidthCm',  'PetalWidthCm'), return_df=FALSE)
#>                    SepalWidthCm PetalWidthCm
#> outlier_count                 1            1
#> outlier_percentage        9.09%        9.09%
#> mean                       2.28         0.77
#> median                      1.5          0.4
#> std                        2.59         1.41
#> lower_range                <NA>         <NA>
#> upper_range                  10            5
Trim outliers
We can trim outliers using trim_outliers. This function will return a dataframe which the outlier has already process by the chosen method.
trim_outliers(df,identifier='IQR', method='trim')
#>    SepalLengthCm SepalWidthCm PetalWidthCm
#> 1            5.1          1.4          0.2
#> 2            4.9          1.4          0.2
#> 4            5.5          2.0          0.3
#> 5            5.1          0.7          0.4
#> 6           10.0          1.6          0.5
#> 8            5.0          1.4          0.6
#> 9            5.2          1.8          0.4
#> 10           5.3          1.5          0.2
Visualize outliers
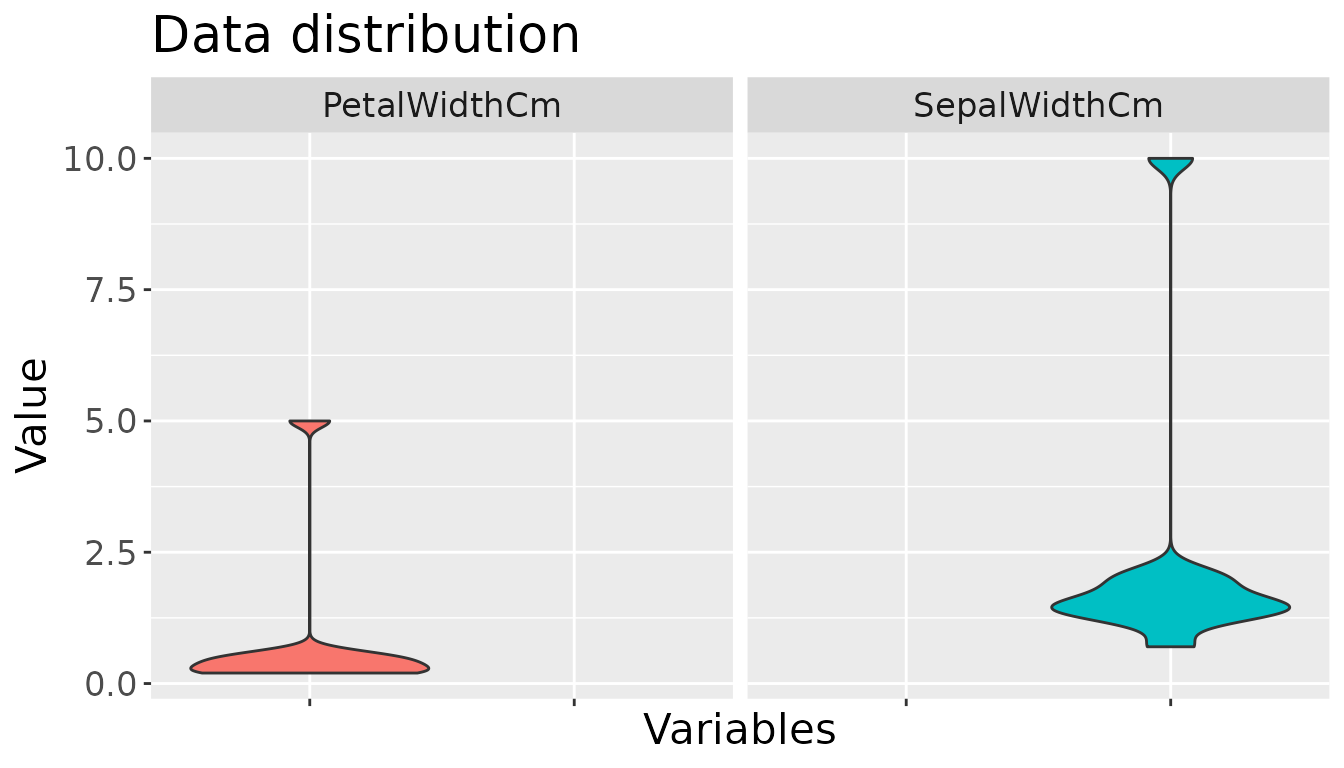
We can trim outliers using visualize_outliers. This function will return a ggplot of data distribution with given method.
visualize_outliers(df, columns=c("SepalWidthCm", "PetalWidthCm"), type="violin")