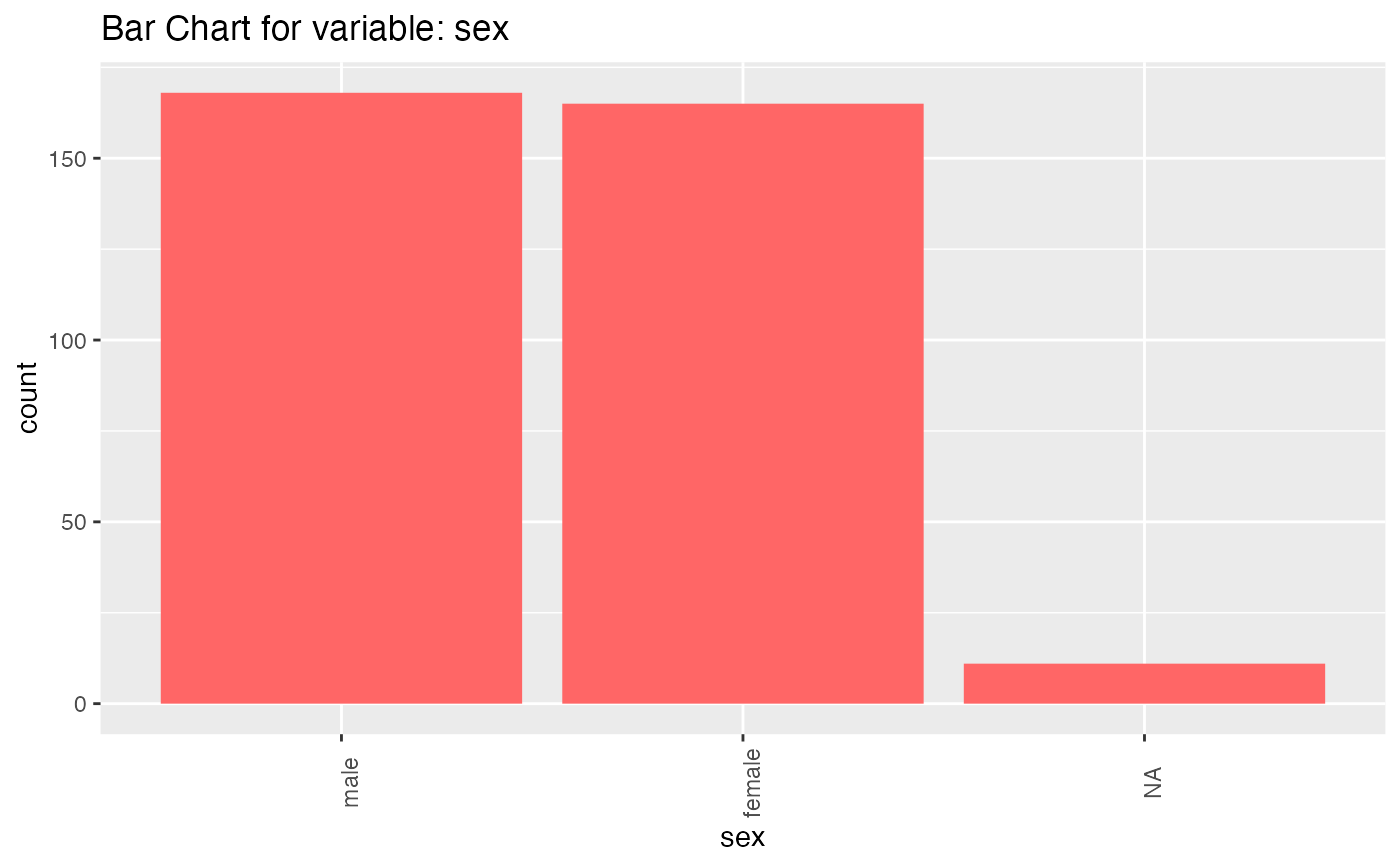
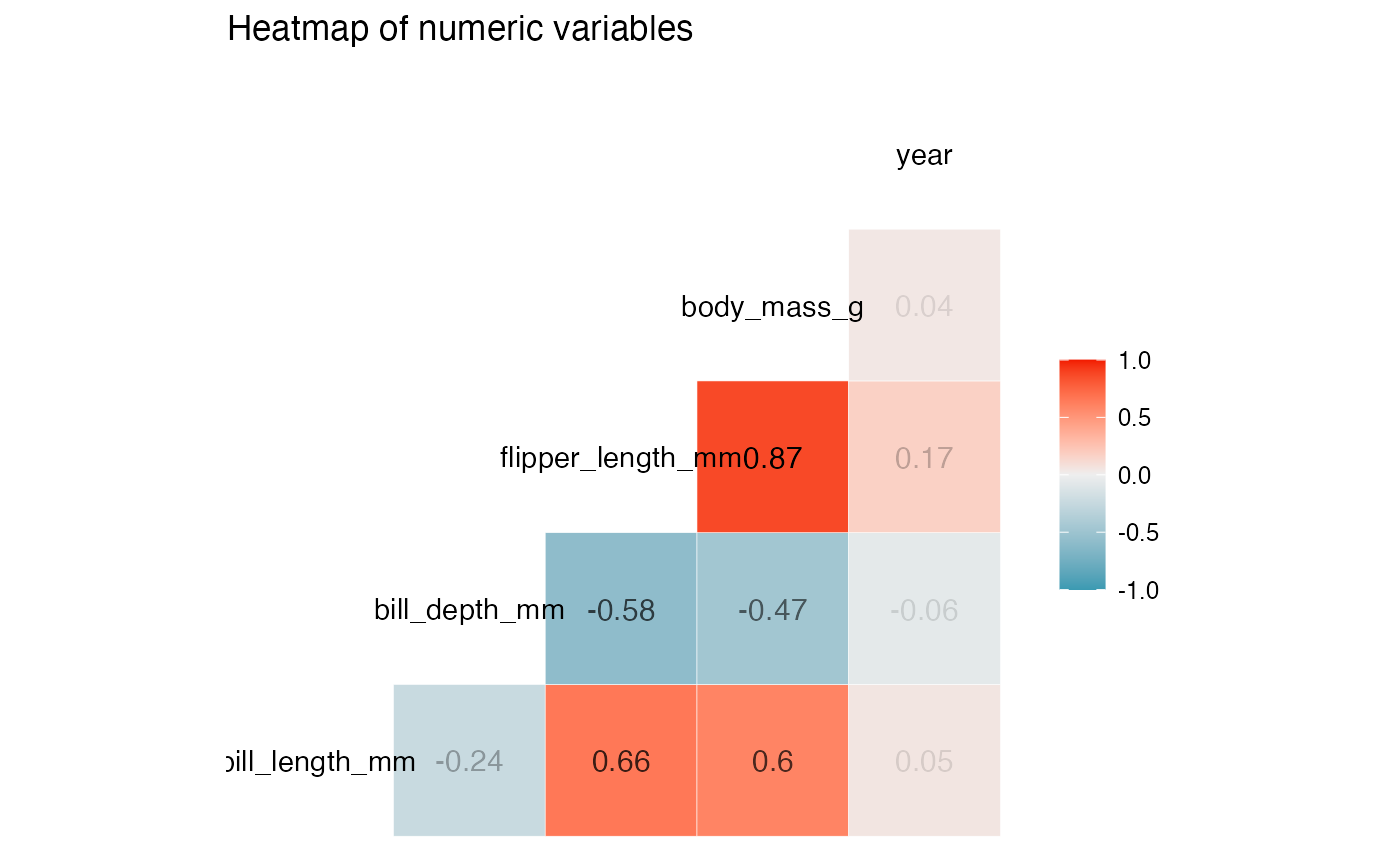
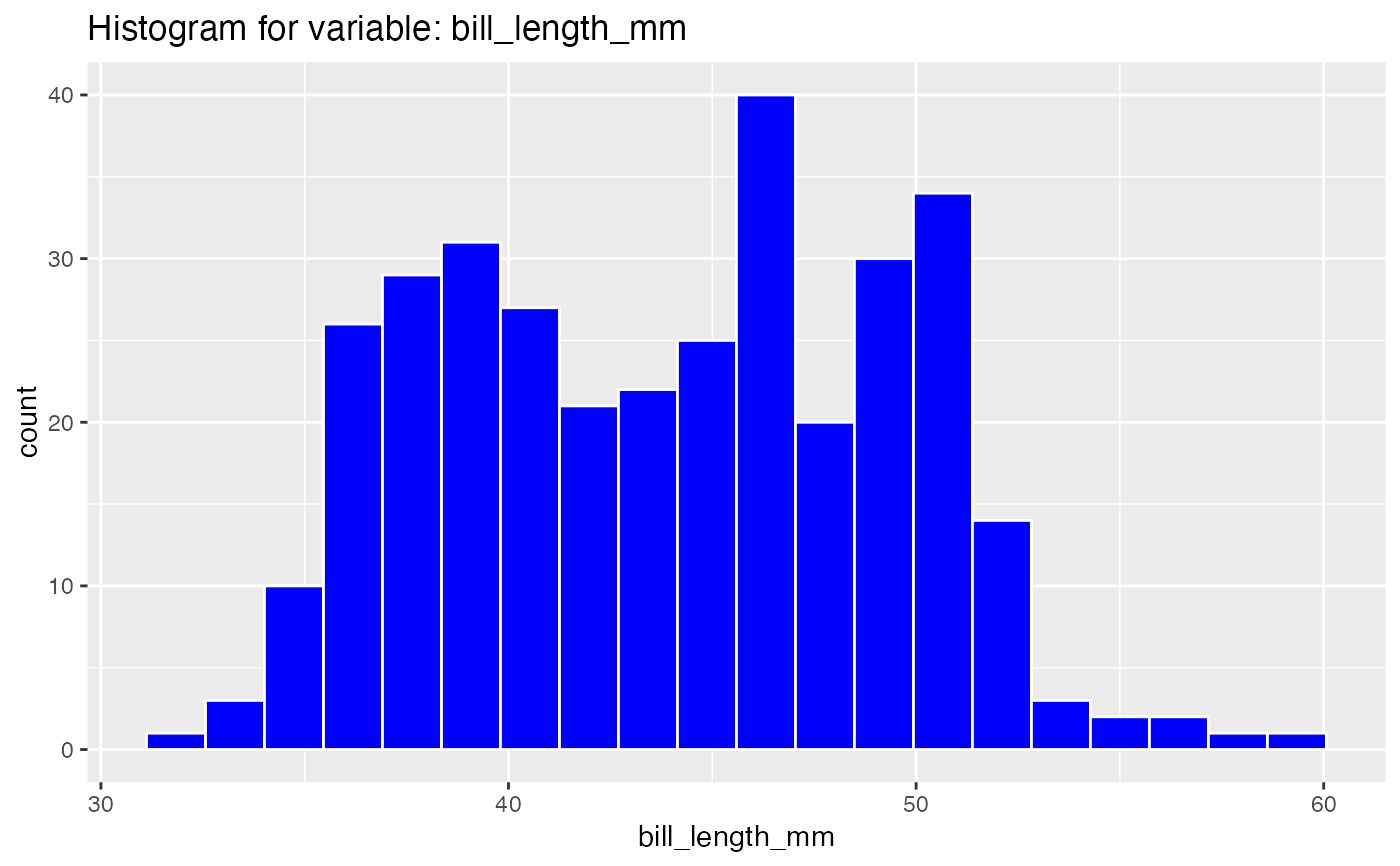
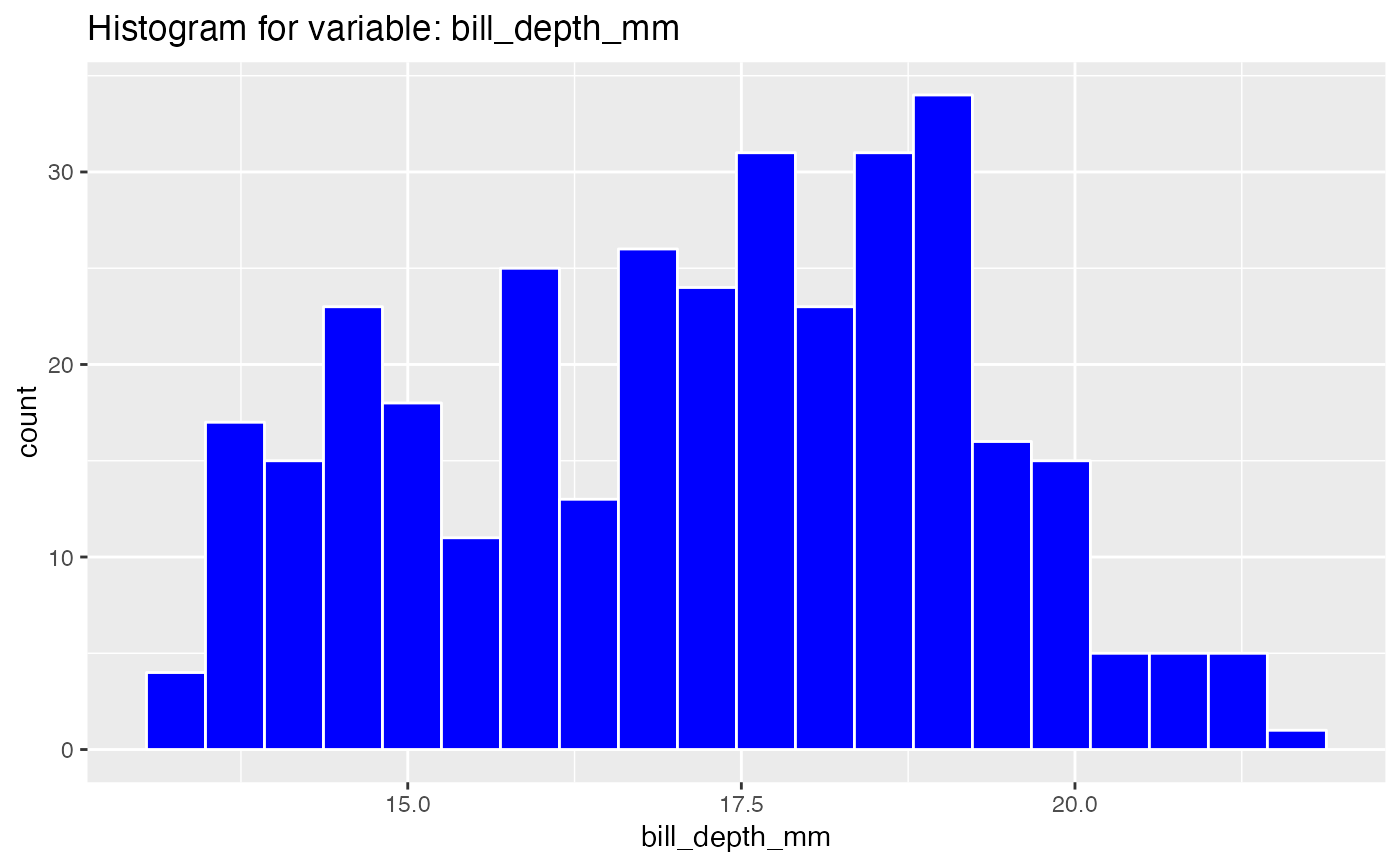
High level EDA: histograms, bar chart, and correlation heatmap
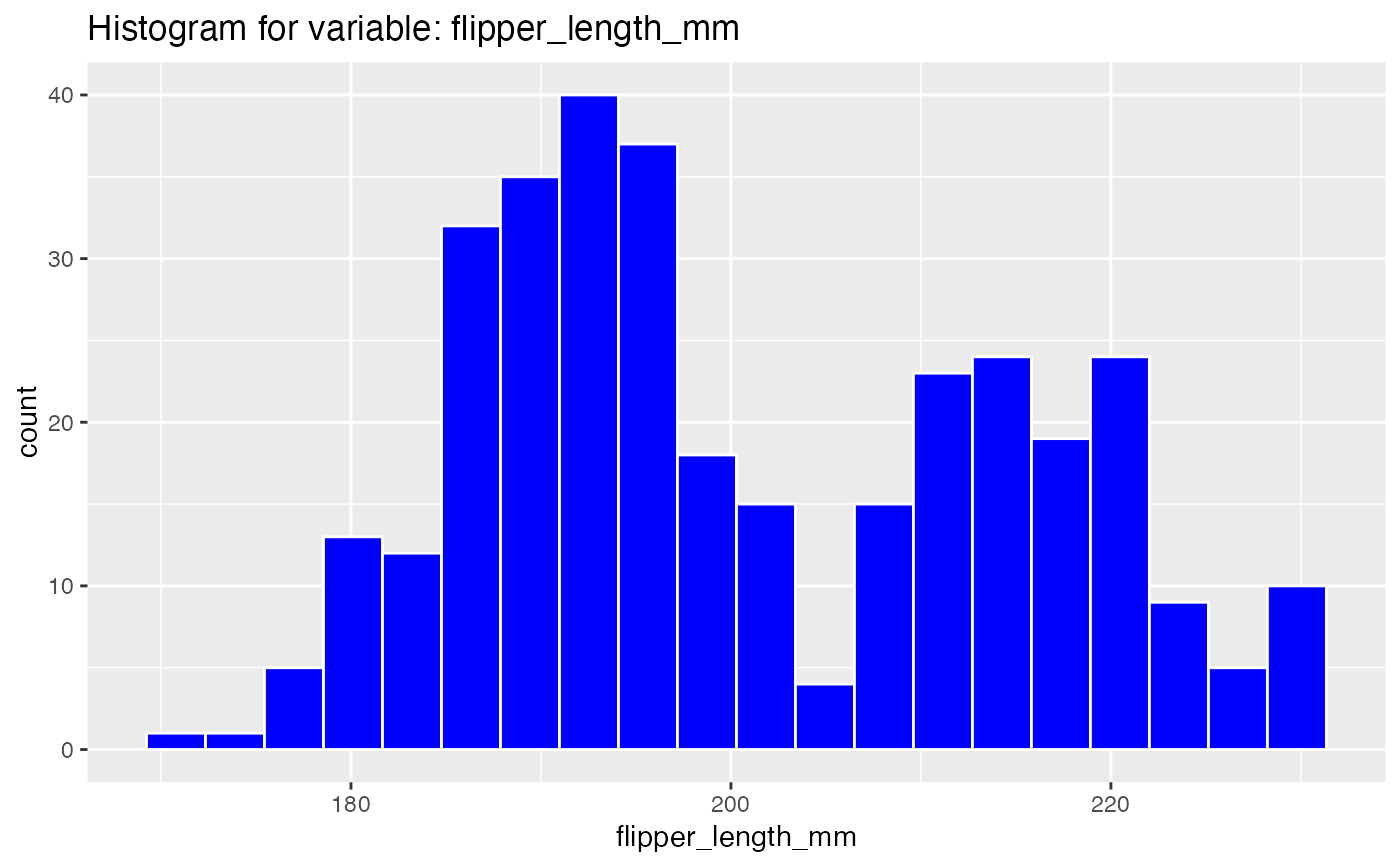
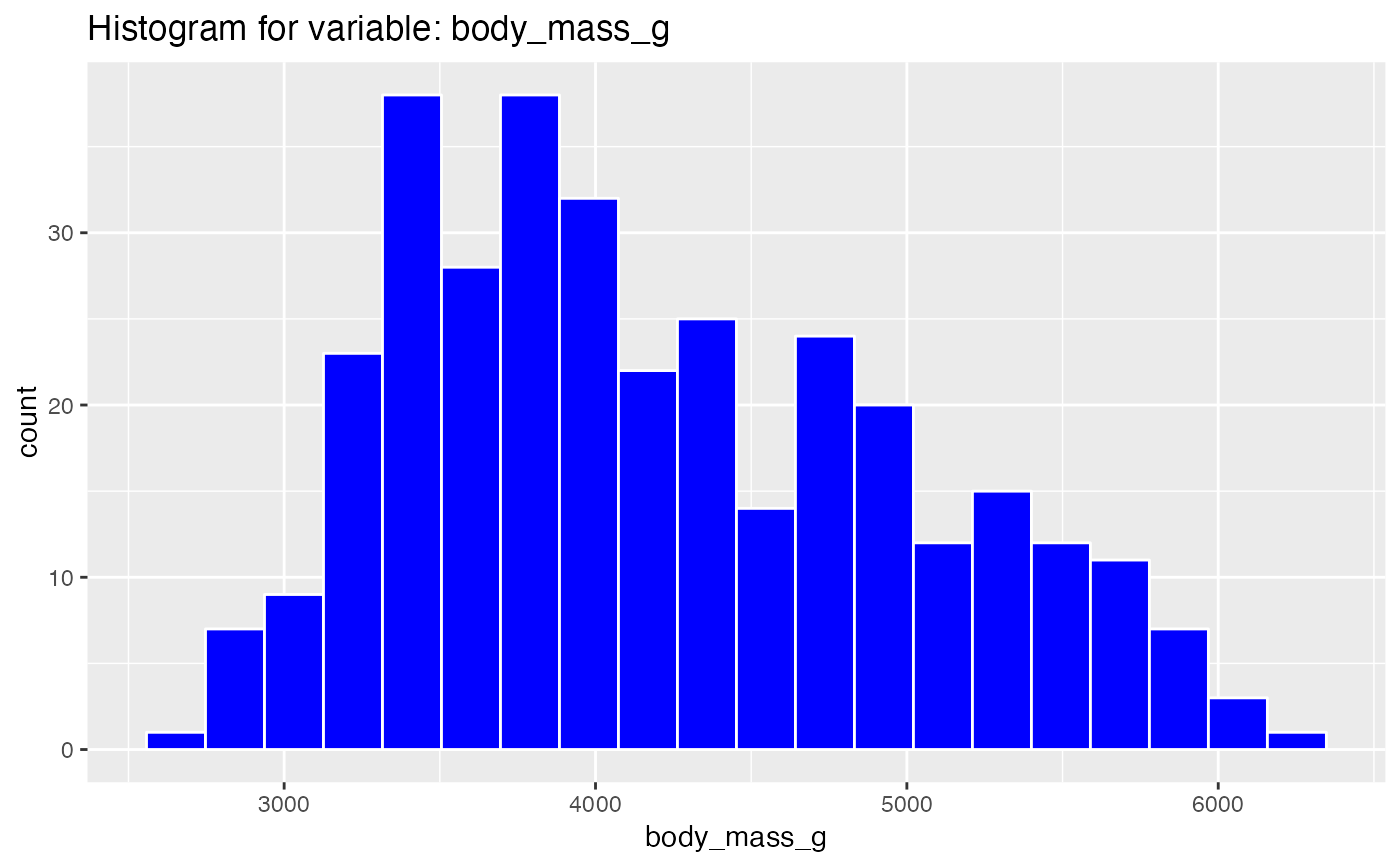
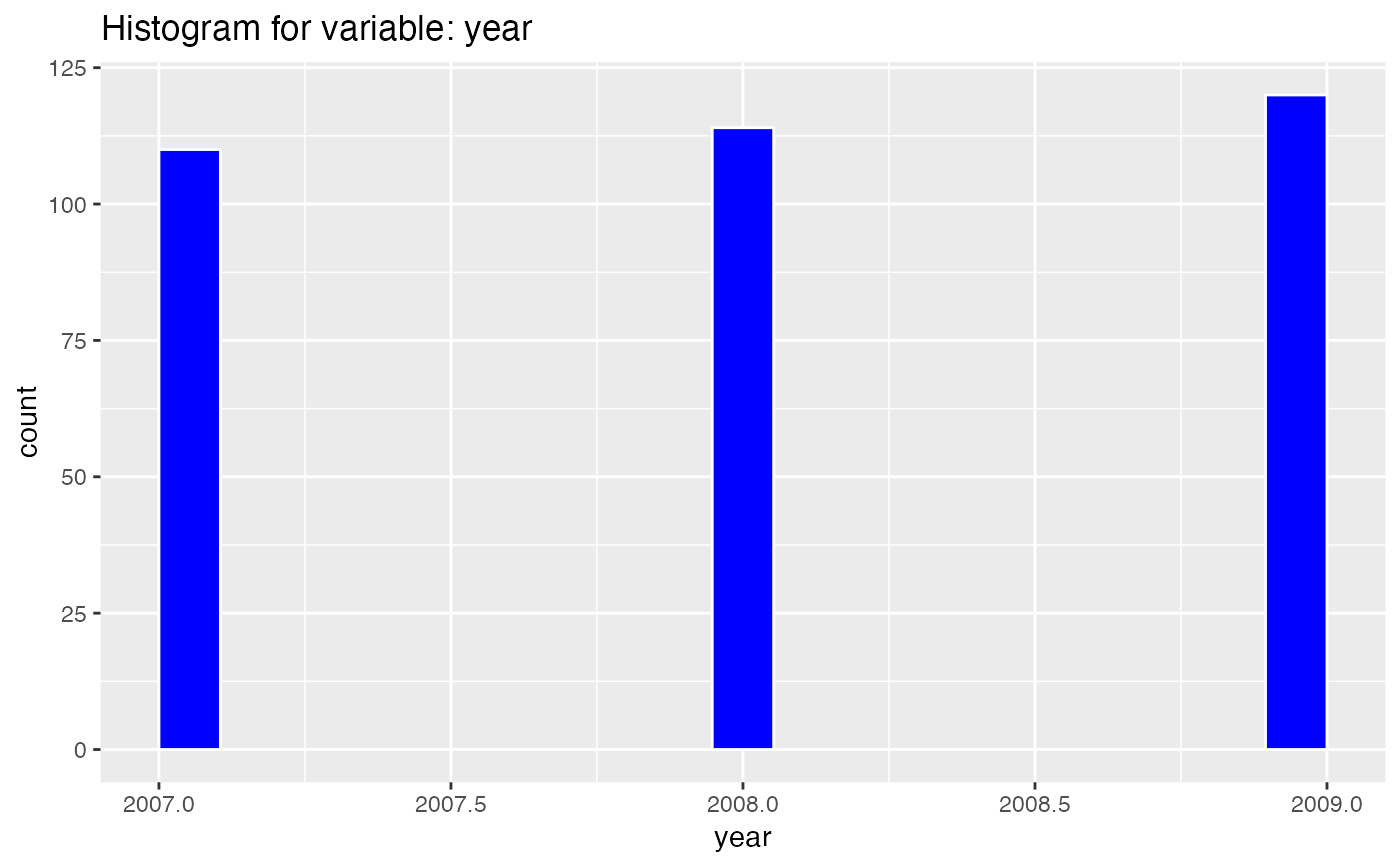
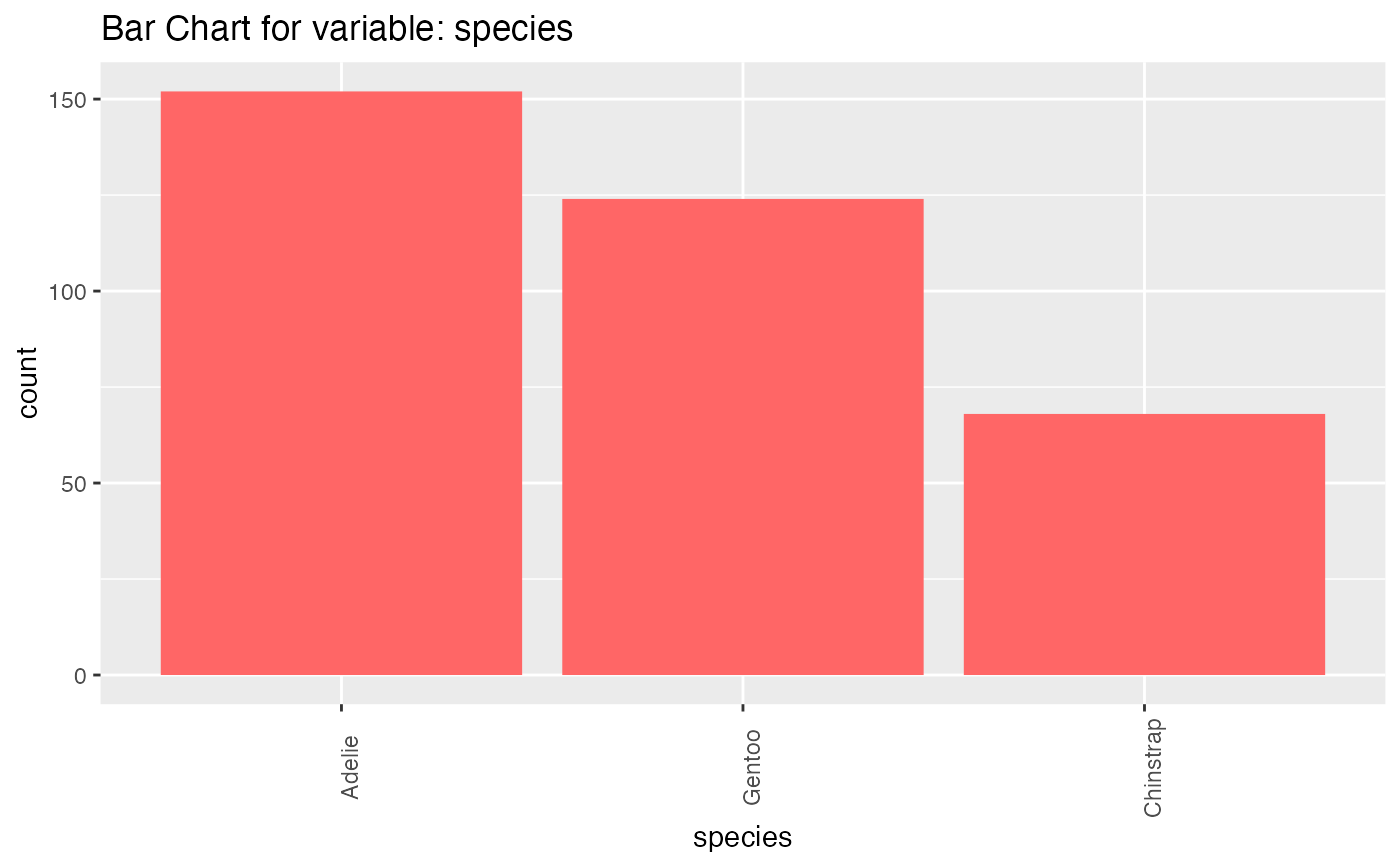
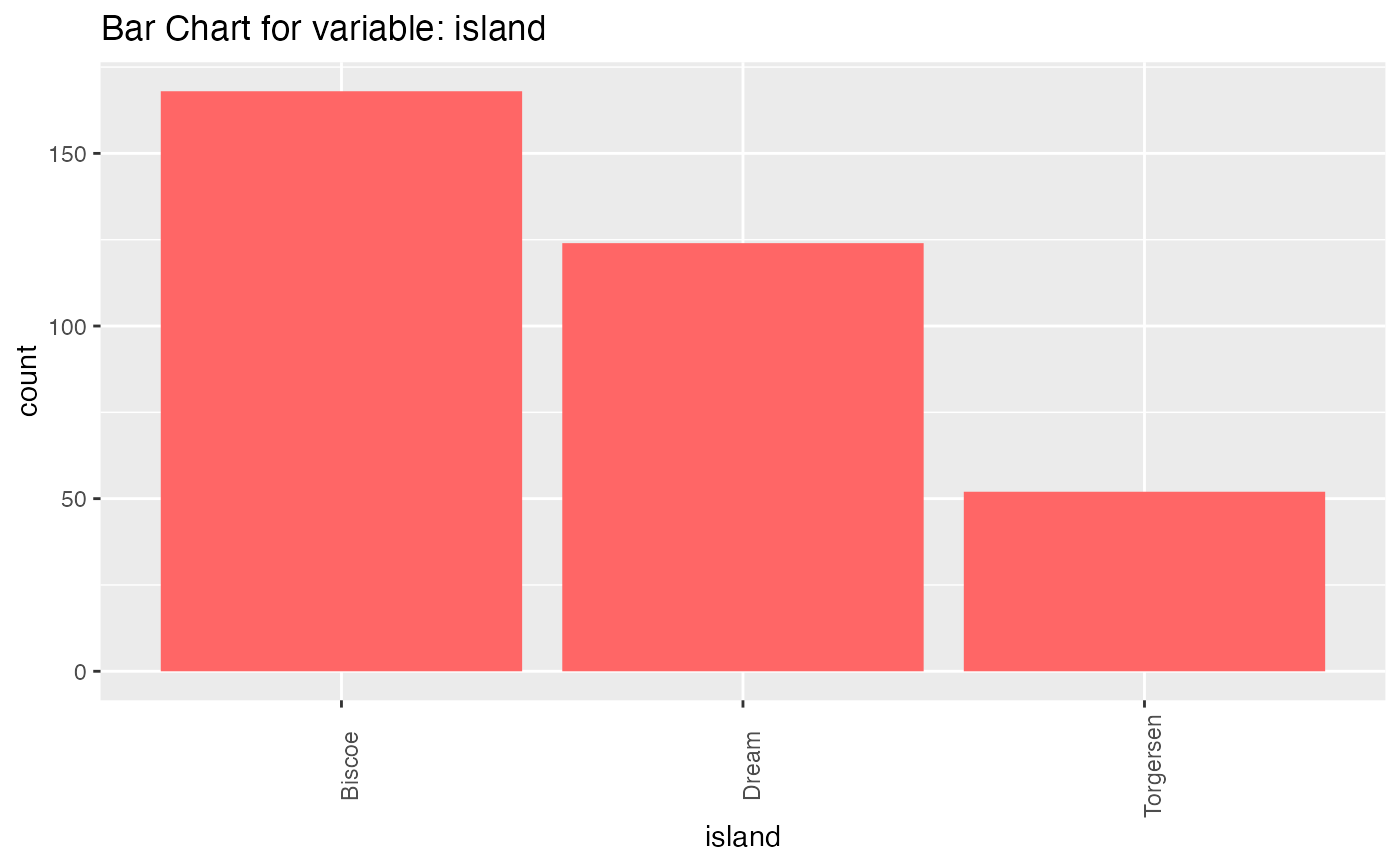
birds_eye_view.RdThis function performs high level EDA on all, or a specific set of features displaying 3 different visualization sets: histograms for each numeric variable, a bar chart for each factor type categorical variable, and a correlation heatmap of the numeric variables.
birds_eye_view(df, n = 20, var_list = NULL)Arguments
- df
A data.frame. The dataframe on which visualizations will be created
- n
An integer. If passed, it will specify the number of bins for the histograms, defaults to 20
- var_list
A vector. If passed, it will limit visualizations to a subset of variables
Value
a list of the visualization objects generated created by the function
Examples
library(palmerpenguins)
results <- birds_eye_view(penguins)
#> Warning: Removed 2 rows containing non-finite values (stat_bin).

#> Warning: Removed 2 rows containing non-finite values (stat_bin).

#> Warning: Removed 2 rows containing non-finite values (stat_bin).

#> Warning: Removed 2 rows containing non-finite values (stat_bin).


#> Registered S3 method overwritten by 'GGally':
#>   method from
#>   +.gg   ggplot2
#> Registered S3 method overwritten by 'GGally':
#> method from
#> +.gg ggplot2