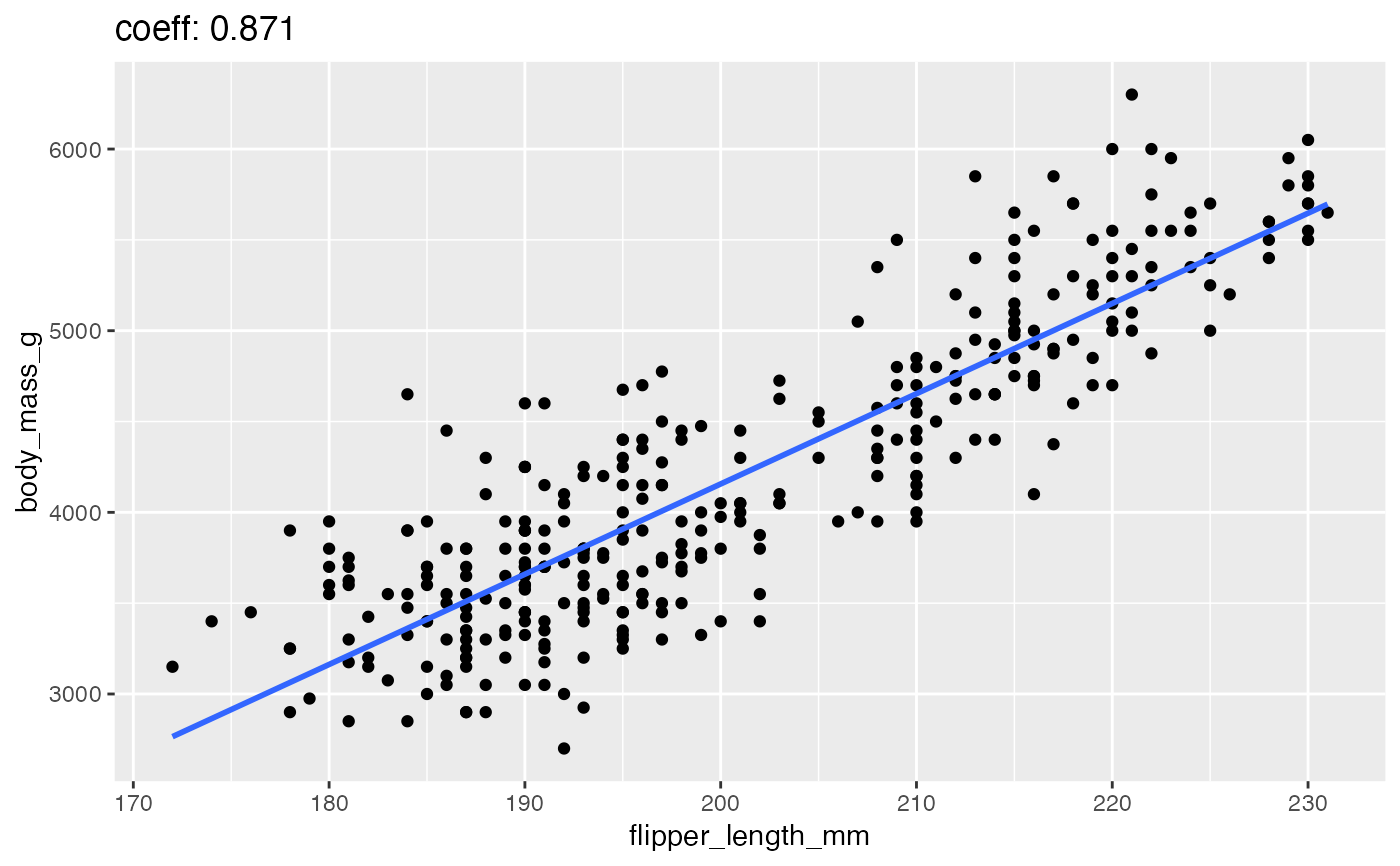
Reveal linear relationships between two variables
close_up.RdAccepts a dataframe and the number of pairs of variables with strongest correlations. It creates scatterplots with a linear trend for each pair of variables with stronglest correlations.
close_up(df, n = 1)Arguments
- df
The dataframe on which the function will operate
- n
The number of pairs of variables with strongest correlations to be displayed, defaults to 1
Value
chart
Examples
library(palmerpenguins)
close_up(penguins)
#> Warning: Removed 2 rows containing non-finite values (stat_smooth).
#> Warning: Removed 2 rows containing missing values (geom_point).