Introduction to rtweetlytics
Mahsa Sarafrazi, Shiva Shankar Jena, Amir Shojakhani, Mahmoodur Rahman
Last compiled on 05 February, 2022
package_name-vignette.RmdThis document introduces you to rtweetlytics and
it’s functions, and shows you how to apply them. Once you’ve installed,
read vignette("Introduction to rtweetlytics") to learn
more.
This document introduces you to the rtweetlytics
package and all the functions inside it. Here to explore the package we
have used data fetched from twitter as
an example through get_store() function. Once you have
installed the package read vignette("Introduction to
rtweetlytics") to learn more about it.
Set up
To get access to the Twitter API and collect and store data in the form of csv, we will use functions from rtweetlytics
Overview
The goal of rtweetlytics is to extract and analyze tweet and finally create meaningful plot. It provides functions to download and store data, clean tweets, analyze tweets and create plot.
The package is an assimilation of four independent functions:
get_store(): Extract data from twitter through calling API and provide csv file as output and create a dataframe.clean_tweets(): Cleans the text in the tweets and returns as new columns in the dataframe. The cleaning process includes converting into lower case, removal of punctuation, hastags and hastag counts.analytics(): Analyze the clean data frame extracted from twitter website, and returns a tibble including metrics of analytics.plotting(): The plotting function creates a bar-chart plot of most occurring hashtags.
Load the library
library(rtweetlytics)1. Downloading data and creating dataframe
The first function in our library is the
rtweetlytics::get_store(). This function will require tghe
developer to obtain bearer token from the twitter API development
website.
tweets = rtweetlytics::get_store(
            bearer_token,
            keyword="vancouver",
            start_date="2022-01-12",
            end_date="2022-01-17")
head(tweets)
#> data.text
#> 1 RT @TrishKurralinga: @Ctl_Alt_Del @PCKJ3627 I am reading a number of teachers are pulling the pin to ensure they don’t bring Omicron home f…
#> 2 As Omicron Crests, Booster Shots Are Keeping Americans Out of Hospitals https://t.co/ms03kYYNO8
#> data.author_id data.referenced_tweets data.lang
#> 1 2.996786e+09 list(type = "retweeted", id = "1484905705740333059") en
#> 2 1.297973e+18 NULL en
#> data.id data.created_at data.source data.reply_settings
#> 1 1.48504e+18 2022-01-22T23:59:59.000Z Twitter for iPhone everyone
#> 2 1.48504e+18 2022-01-22T23:59:59.000Z WordPress.com everyone
#> data.conversation_id data.in_reply_to_user_id
#> 1 1.48504e+18 NA
#> 2 1.48504e+18 NA
#> data.public_metrics.retweet_count data.public_metrics.reply_count
#> 1 7 0
#> 2 0 0
#> data.public_metrics.like_count data.public_metrics.quote_count
#> 1 0 0
#> 2 0 02. Cleaning data
The second function in our library is the
rtweetlytics::clean_tweets(). This function cleans the data
to gets tweet texts, word counts.
PATH <- "../output/tweets_response.csv"
tweets_df <- rtweetlytics::clean_tweets(PATH, tokenization=TRUE, word_count=TRUE)
head(tweets_df)
#> X source author_id created_at conversation_id lang
#> 1 1 Twitter Web App 282220986 2022-01-17 23:59:59 1.483228e+18 en
#> 2 2 Talon Android 932214247 2022-01-17 23:59:58 1.483228e+18 en
#> reply_settings referenced_tweets
#> 1 everyone [{'type': 'retweeted', 'id': '1483167691825418241'}]
#> 2 everyone [{'type': 'retweeted', 'id': '1482901087296311300'}]
#> id
#> 1 1.483228e+18
#> 2 1.483228e+18
#> text
#> 1 RT @MaximeBernier: Some mainstream media are finally recognizing that the covid hysteria has gone too far and are beginning to question it.…
#> 2 RT @DrJ56013122: I have yet to see a single research article convincingly showing that a booster reduces transmission or reduces the likeli…
#> in_reply_to_user_id retweetcount reply_count like_count quote_count
#> 1 NA 931 0 0 0
#> 2 NA 30 0 0 0
#> clean_tweets
#> 1 some mainstream media are finally recognizing that the covid hysteria has gone too far and are beginning to question it
#> 2 i have yet to see a single research article convincingly showing that a booster reduces transmission or reduces the likeli
#> clean_tokens
#> 1 some,mainstream,media,are,finally,recognizing,that,the,covid,hysteria,has,gone,too,far,and,are,beginning,to,question,it
#> 2 i,have,yet,to,see,a,single,research,article,convincingly,showing,that,a,booster,reduces,transmission,or,reduces,the,likeli
#> word_count
#> 1 20
#> 2 203. Analyzing data
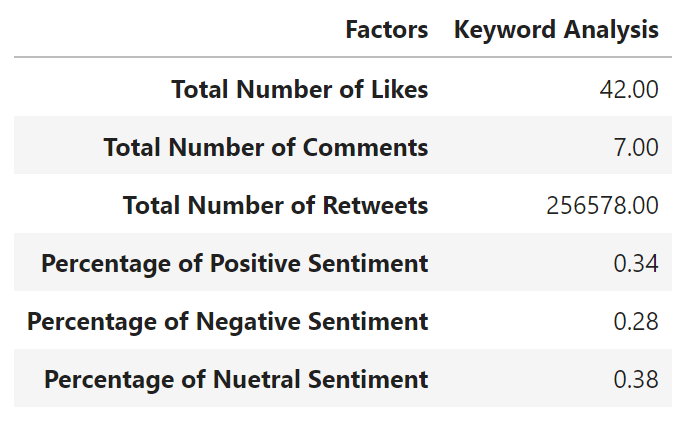
Our third function rtweetlytics::analytic() analyses the
data to give a resulting dataframe showing total Number of Likes, total
Number of Comments, total Number of Retweets, percentage of Positive
Sentiments, percentage of Neutral Sentiments, and percentage of Negative
Sentiments.
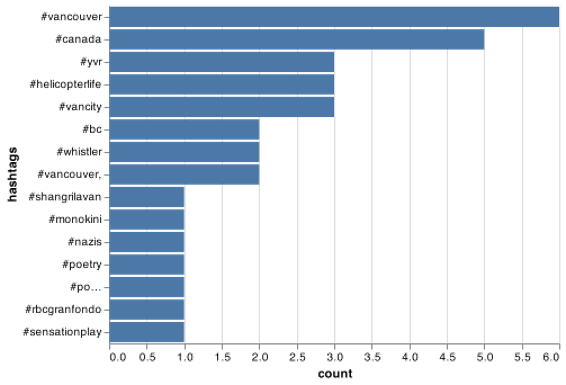
4. Creating plot
In the last and final function we are using
rtweetlytics::plotting() to further clean the data to
extract hastags and plot the top 15 tags.
hash_plot <-  rtweetlytics::plotting(tweets_df, text)
hash_plot