Returns correlation plot for all the columns in dataset
plot_corr.RdReturns correlation plot for all the columns in dataset
plot_corr(data, corr = "pearson", pair_cols = NULL)Arguments
- data
a dataframe
- corr
type of correlation: 'spearman', 'kendall' or 'pearson'
- pair_cols
: a character vector od columns for which you want correlation plot
Value
corr_plot, a ggplot chart object
Examples
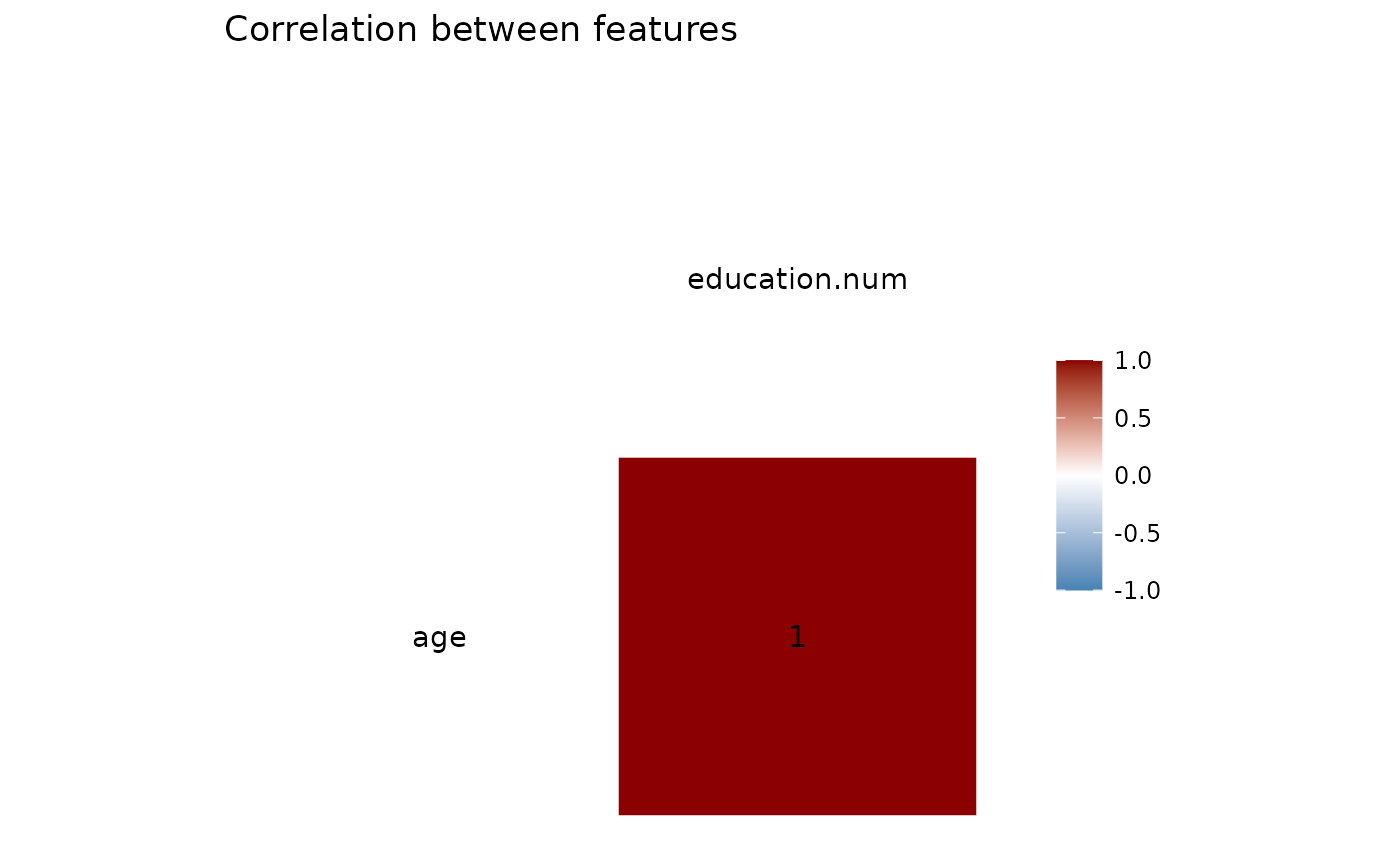
data <- data.frame(age = c(1, 2, 4, 6, 8),education.num = c(3, 6, 12, 18, 24), target=c(20, 30, 12, 0, 2))
plot_corr(data, corr = 'pearson', pair_cols=c('age', 'education.num'))
#> Registered S3 method overwritten by 'GGally':
#> method from
#> +.gg ggplot2
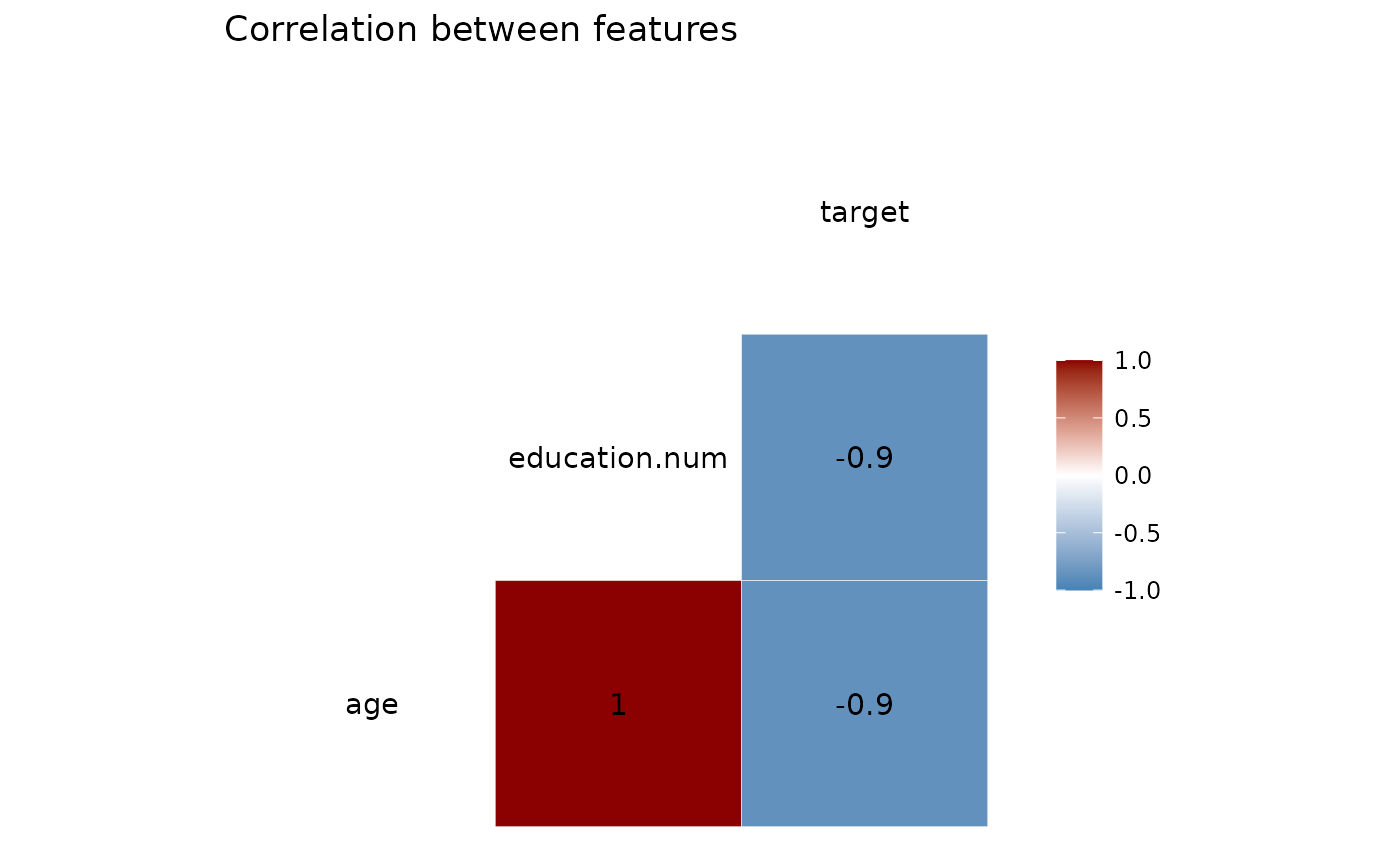
 plot_corr(data)