Returns numerical distribution plots on either all the numeric columns or the ones provided to it
plot_distributions.RdReturns numerical distribution plots on either all the numeric columns or the ones provided to it
plot_distributions(data, bins = 40, hist_cols = NULL, density = FALSE)Arguments
- data
a dataframe
- bins
number of bins in the histogram plot; numeric
- hist_cols
a list of numeric cols
- density
target col in dataframe of type character
Value
chart_numeric, a ggplot chart object
Examples
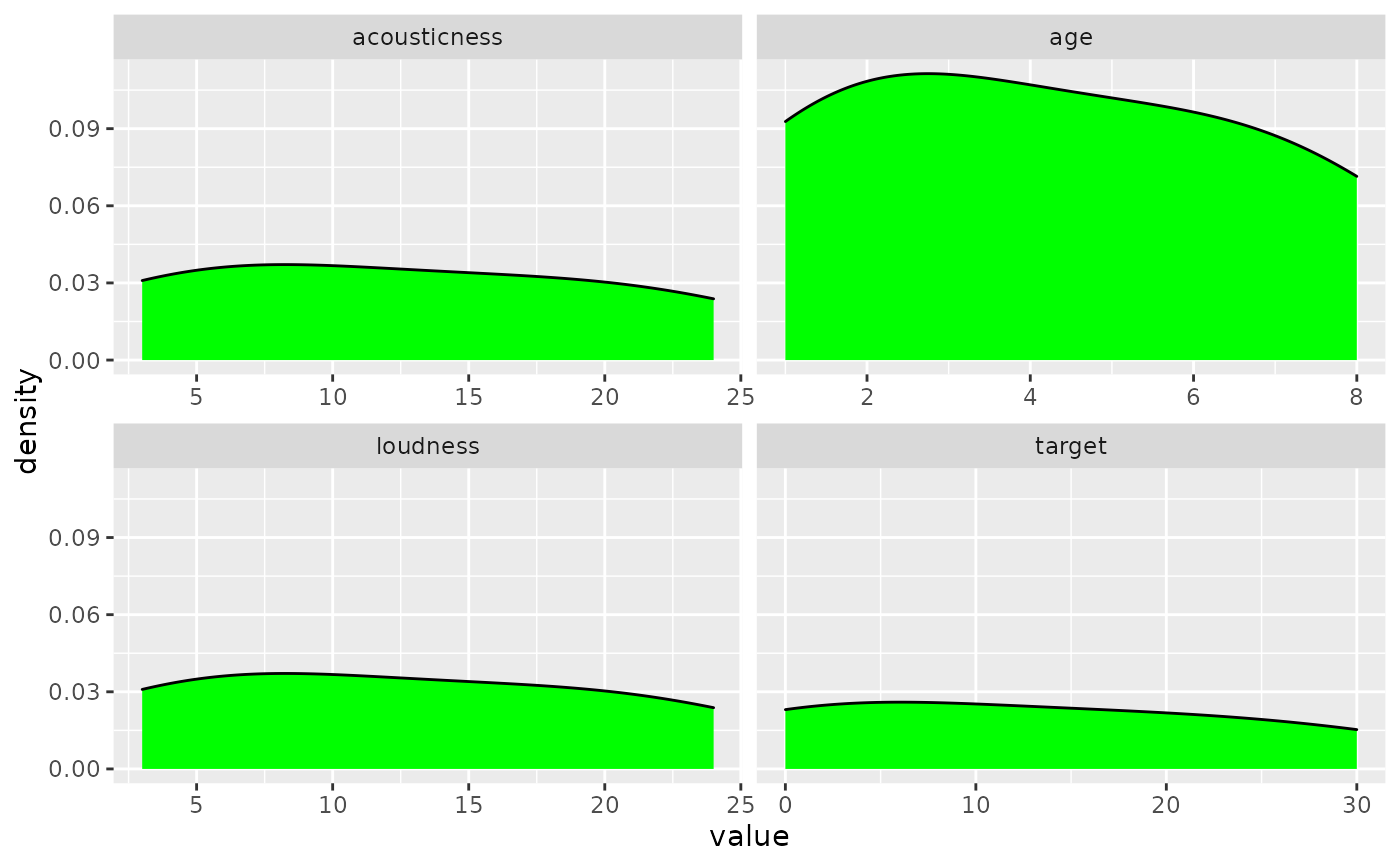
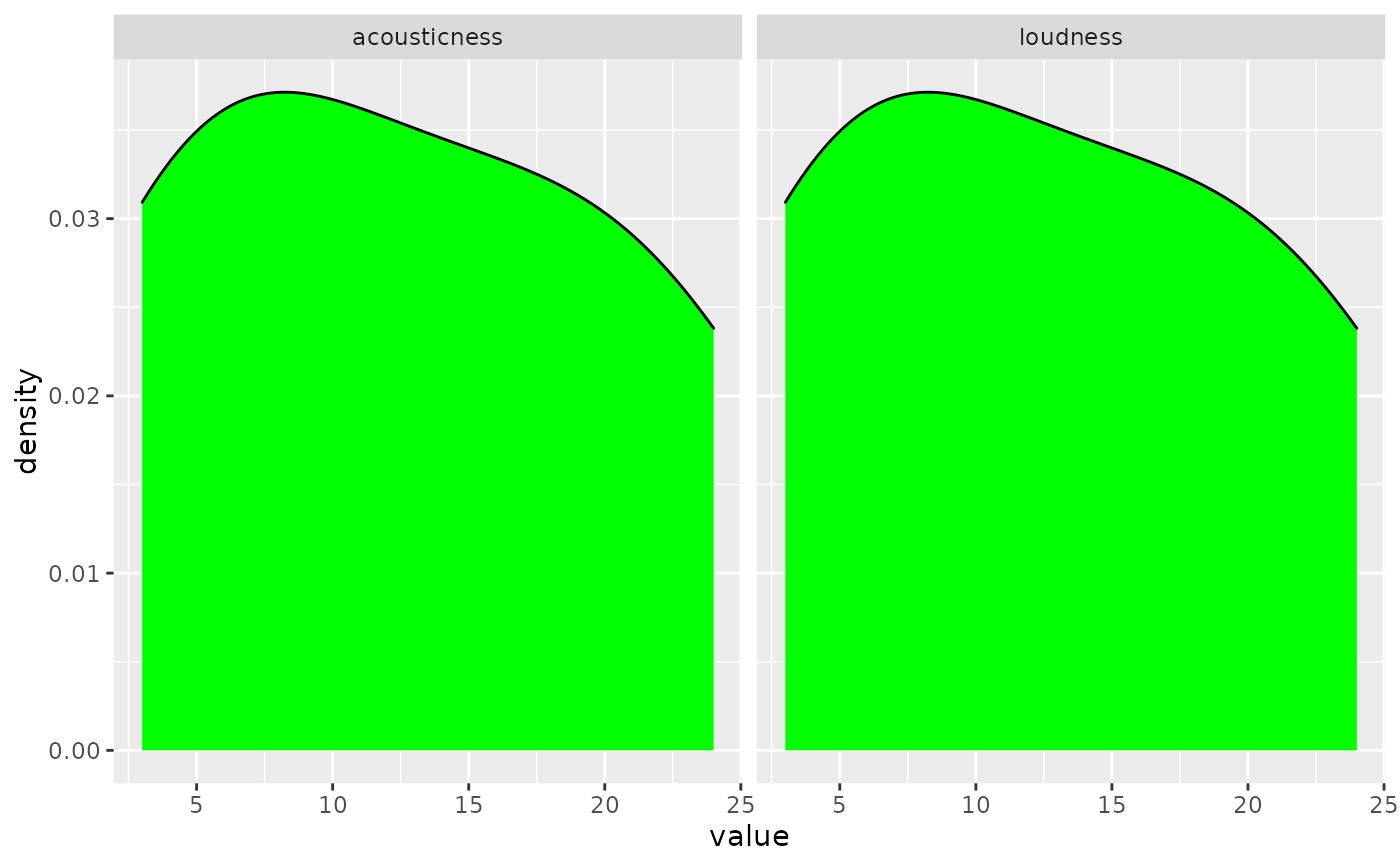
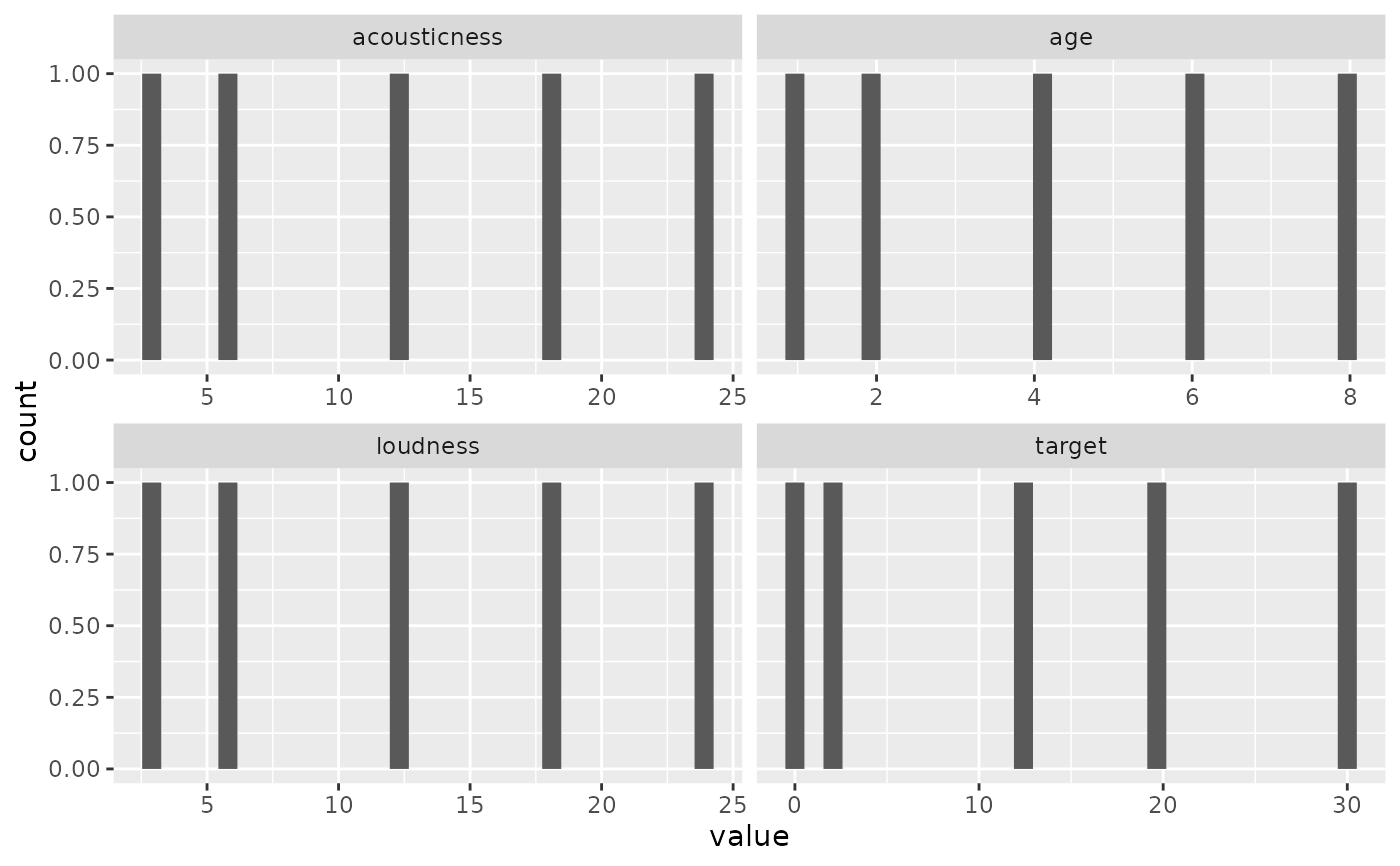
data <- data.frame(age = c(1, 2, 4, 6, 8),acousticness= c(3, 6, 12, 18, 24), loudness= c(3, 6, 12, 18, 24), target=c(20, 30, 12, 0, 2))
plot_distributions(data, bins = 30, hist_cols=c("acousticness", "loudness"), density=TRUE)

plot_distributions(data, bins = 30)

plot_distributions(data, density=TRUE)