Create vizualizations.
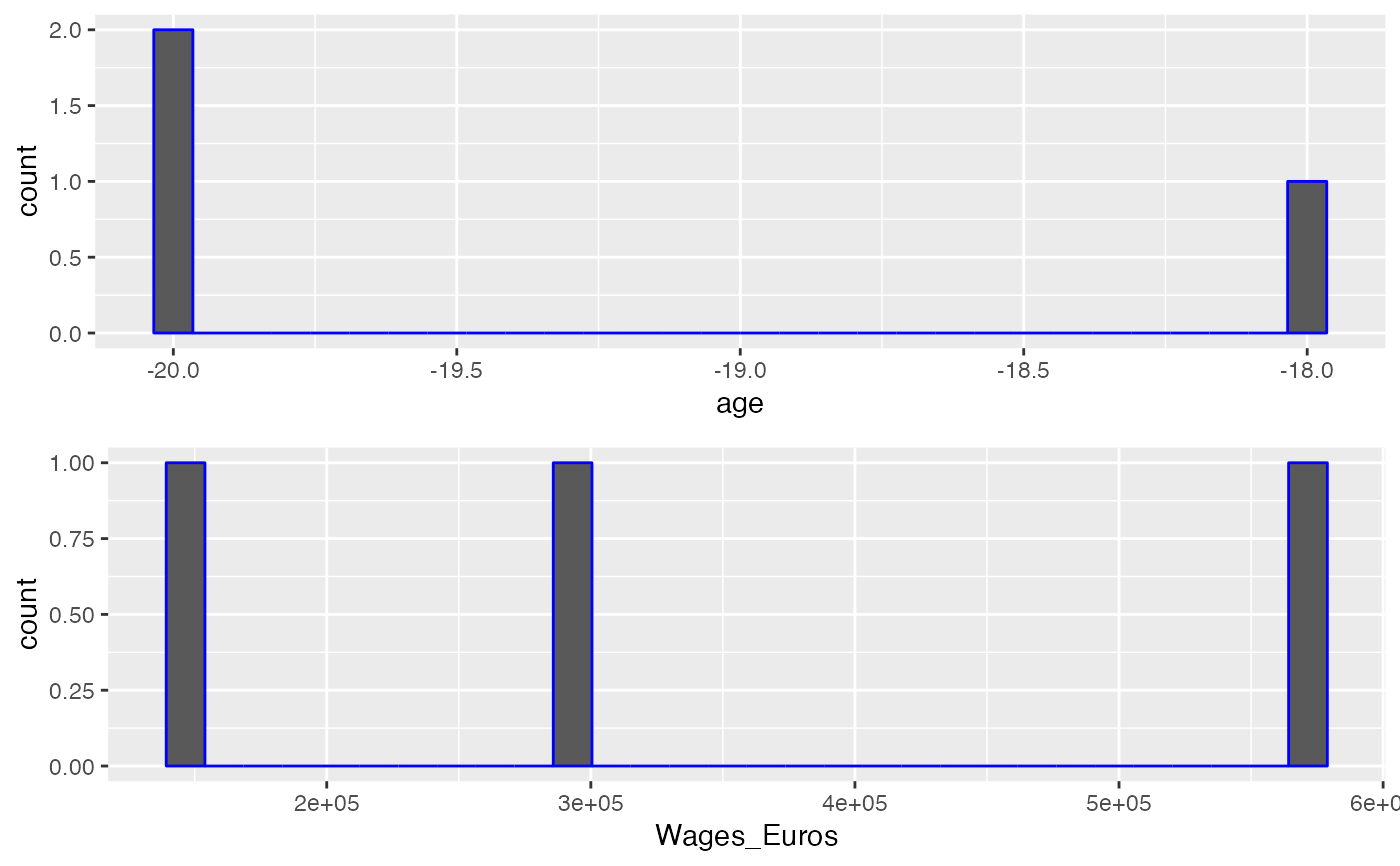
soc_viz_stats.RdCreate a scatter plot of or two histograms based on chosen numerical features.
Arguments
- xcol
Column vector in the dataframe based on which outliers are to be identified.
- ycol
Column vector in the dataframe based on which outliers are to be identified.
- if_scatter
determine if the user want to have scatter plots or histograms.
- df
Dataframe in which vizs are to be generated.
Examples
library(tidyverse)
library(cowplot)
small_data <- data.frame(age = - c(18, 20, 20), Wages_Euros = c(300000, 575000,  150000))
soc_viz_stats('age', 'Wages_Euros', FALSE , small_data)
#> `stat_bin()` using `bins = 30`. Pick better value with `binwidth`.
#> `stat_bin()` using `bins = 30`. Pick better value with `binwidth`.
