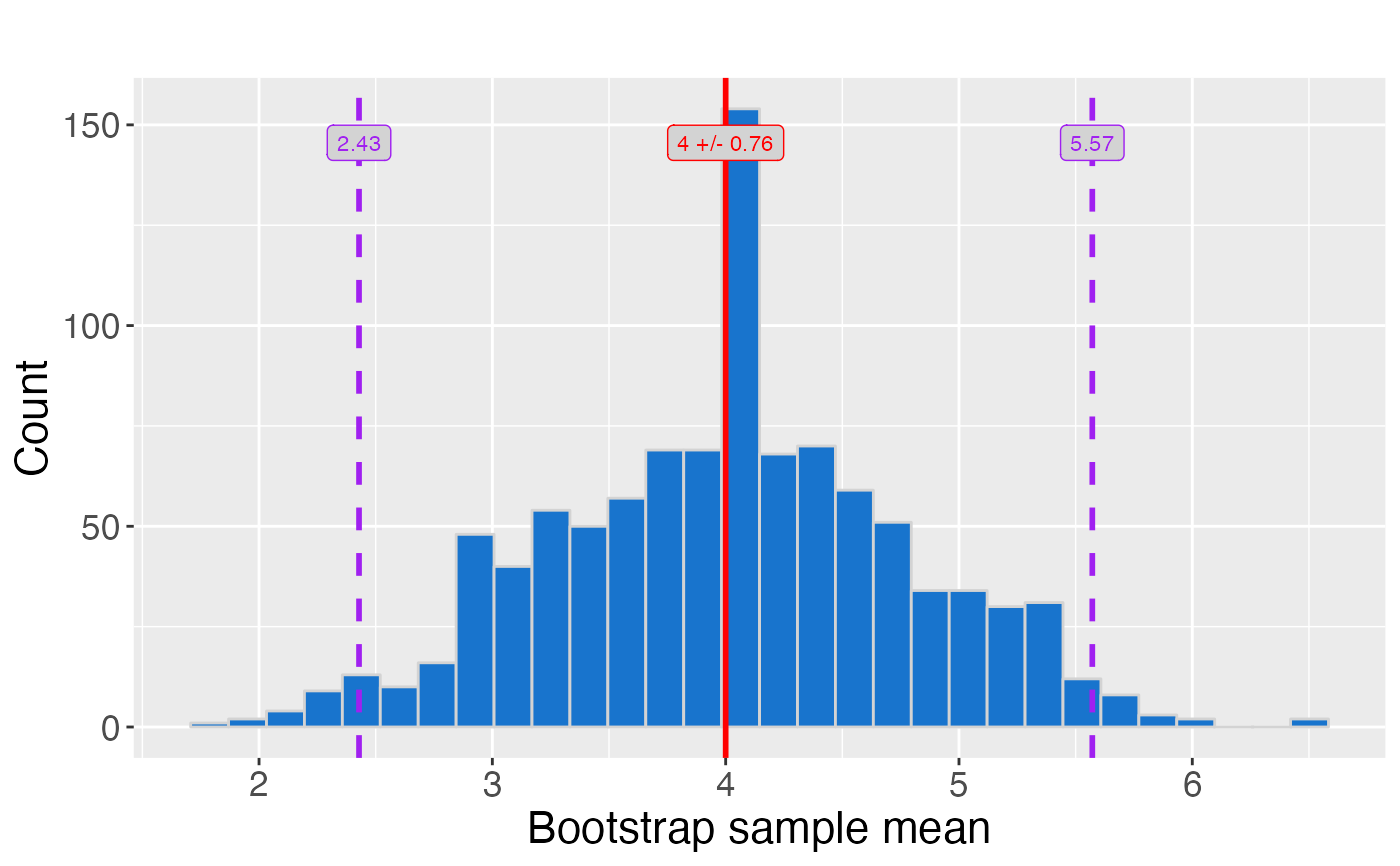
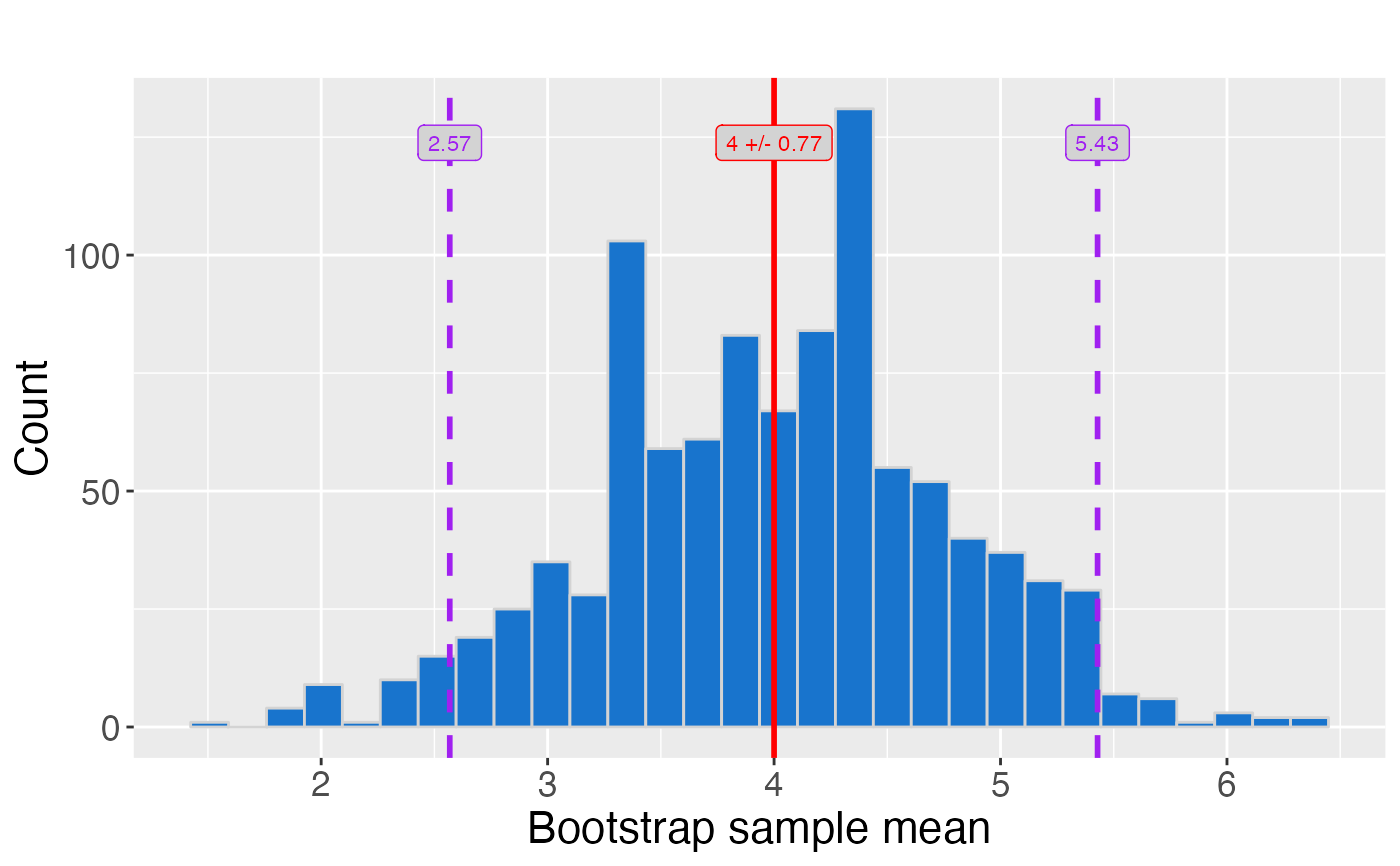
Plots a bootstrapped sampling distribution with its confidence interval and observed mean.
plot_ci.RdA bootstrapped confidence interval for the desired estimator for the provided
sample is calculated for a confidence level level.
Usage
plot_ci(
  sample,
  rep,
  bin_size = 30,
  n = "auto",
  level = 0.95,
  seed = NULL,
  title = "",
  y_axis = "Count",
  estimator = "mean",
  path = NULL
)
Arguments
- sample
A numeric vector to bootstrap
- rep
A integer vector for number of replicates
- bin_size
A integer vector for number of bins representing intervals of equal size over the range
- n
A integer or character vector for the size of bootstrap samples
- level
A numeric vector for the confidence level
- seed
A integer vector as seed.
- title
A character vector for the title of the histogram
- y_axis
A character vector for the name of the y axis
- estimator
A character vector containing one of the("mean", "median", "var", "sd") estimators
- path
A character vector for the path to directory from current directory to save plot