xplrrr aims to simplify data exploration with R in four aspects:
- feature correlation visualization
- data summary
- outliers detection
- missing data
The package was developed as part of UBC MDS course.
First, start with loading the library
In this vignette we will be working with the iris dataset.
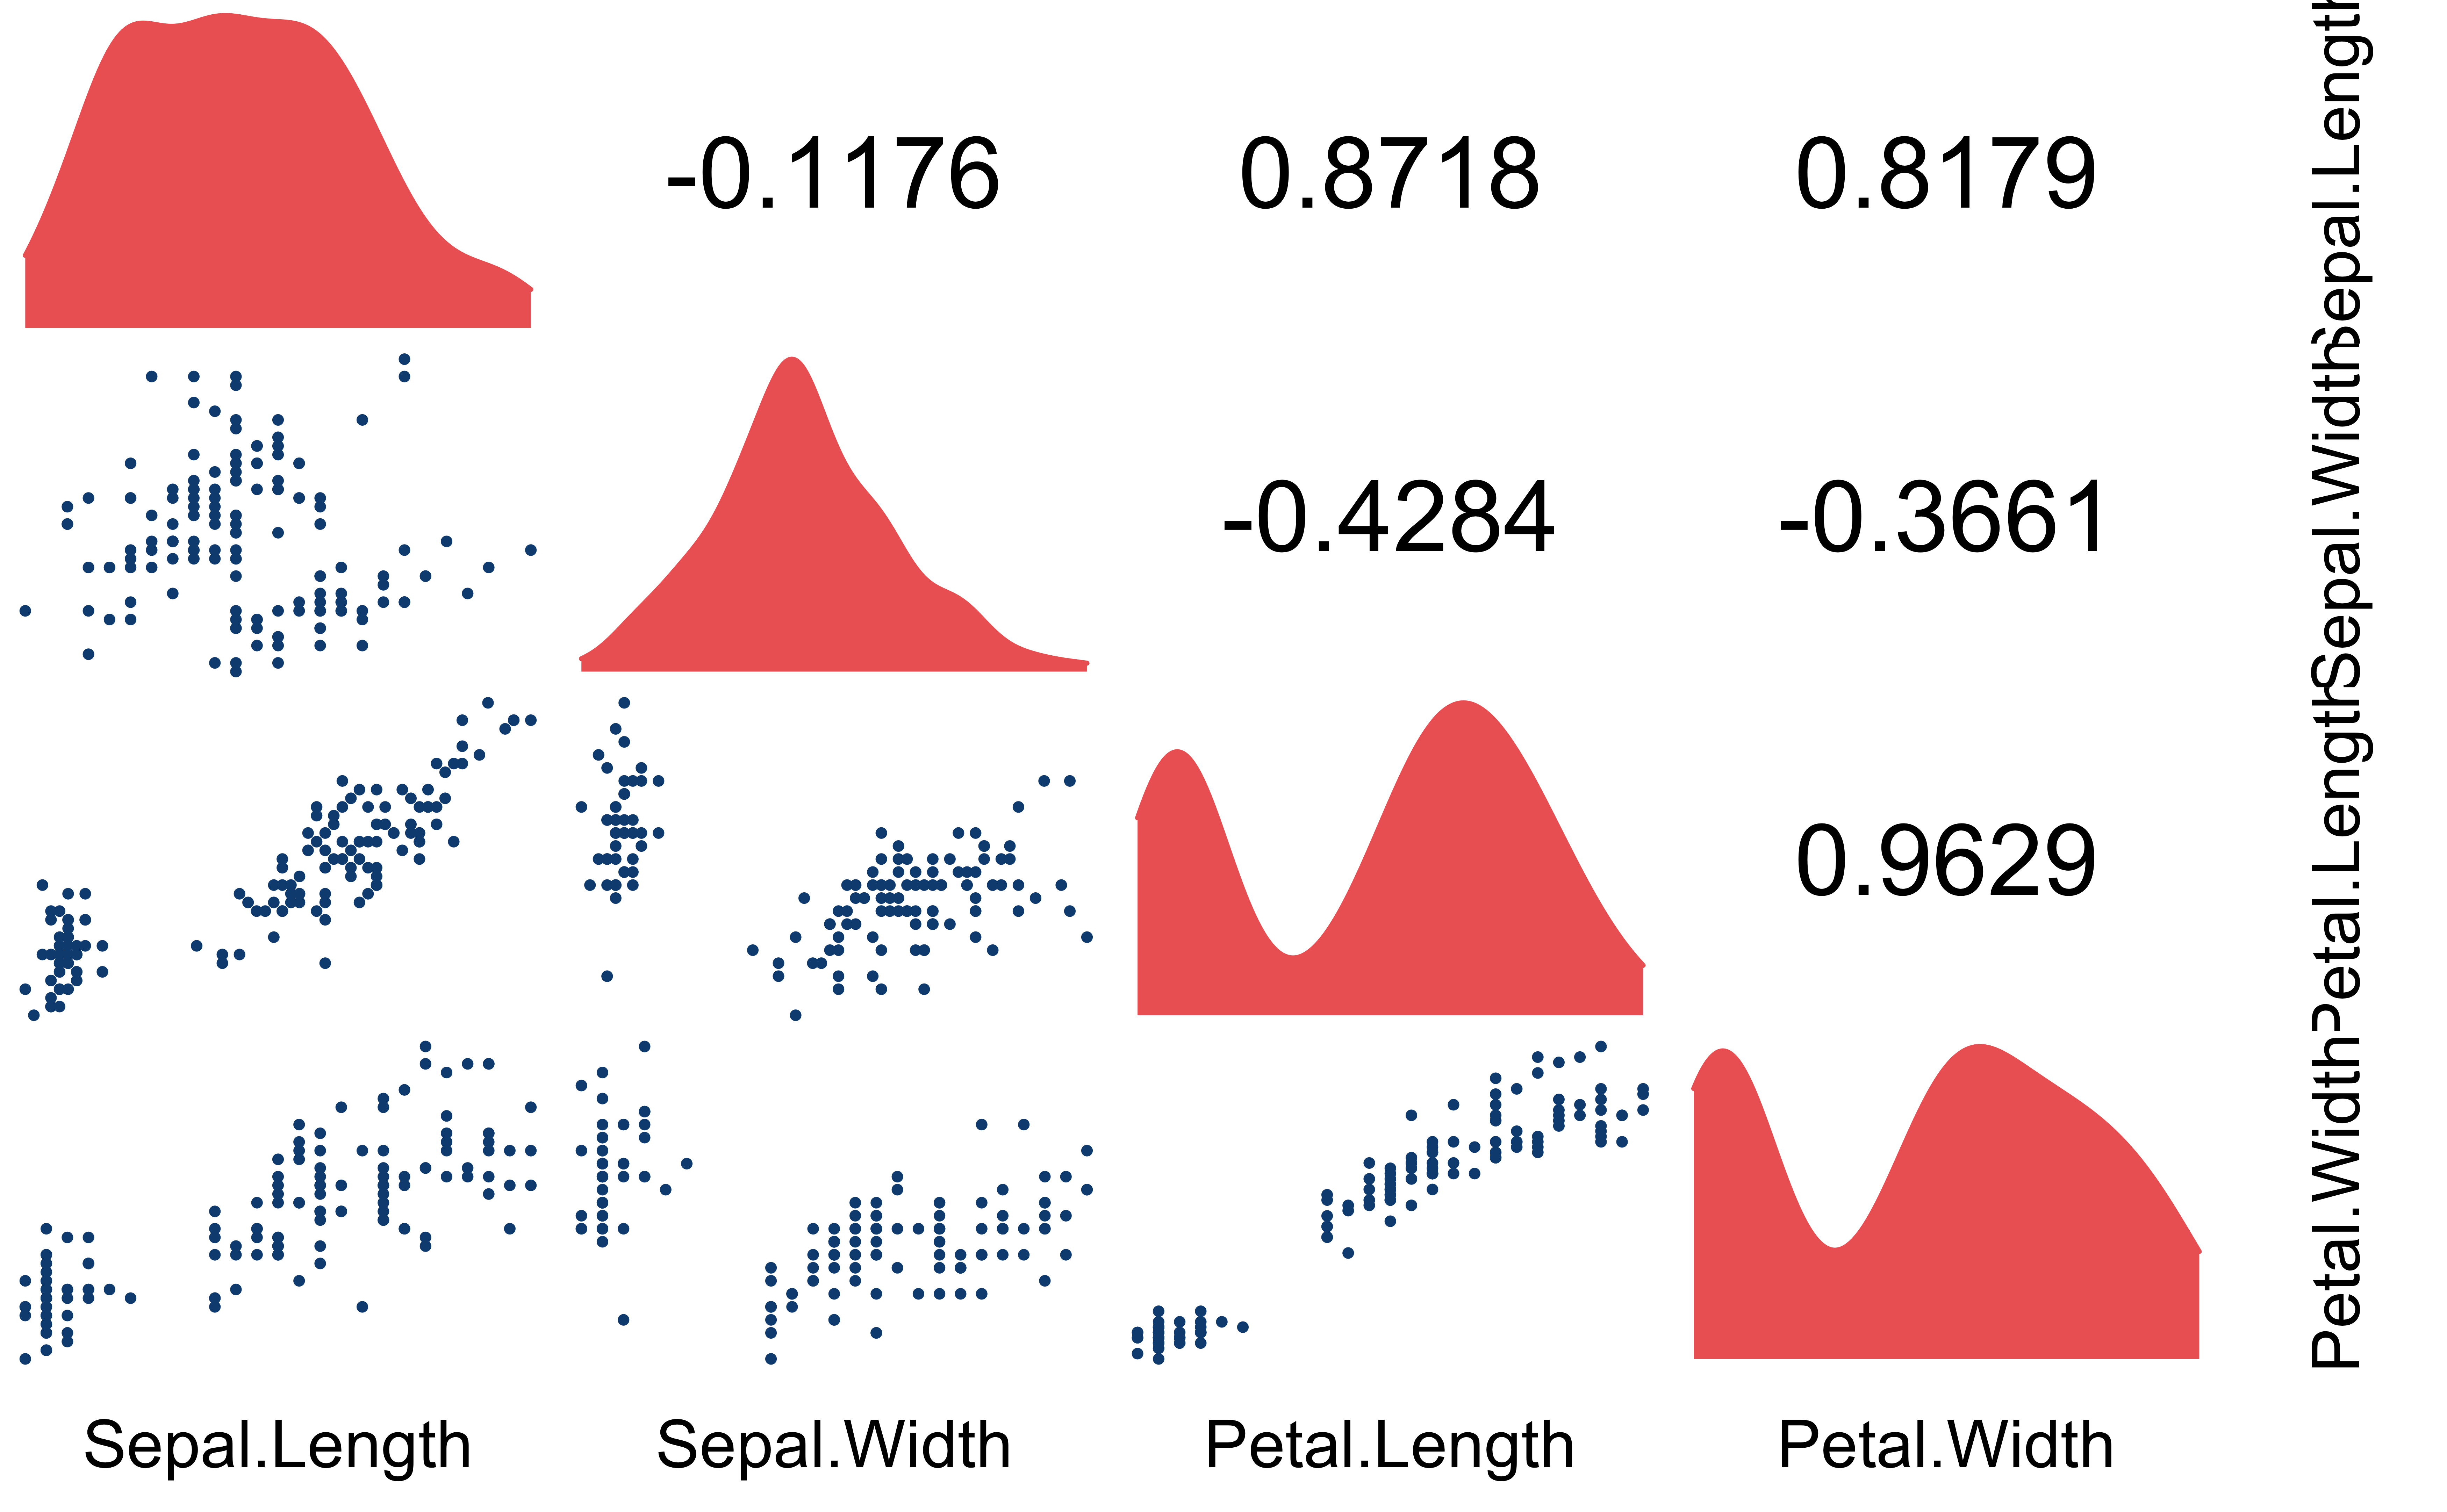
At first, let’s visualize our features and their pairwise correlations and distributions:

Now let’s explore summary statistics:
##              min. 1st Qu. median 3rd Qu. max.     mean       var
## Sepal.Length  4.3     5.1   5.80     6.4  7.9 5.843333 0.6856935
## Sepal.Width   2.0     2.8   3.00     3.3  4.4 3.057333 0.1899794
## Petal.Length  1.0     1.6   4.35     5.1  6.9 3.758000 3.1162779
## Petal.Width   0.1     0.3   1.30     1.8  2.5 1.199333 0.5810063
Let’s see if there are any outliers:
##              outlier_count
## Sepal.Length             6
## Sepal.Width              5
## Petal.Length             0
## Petal.Width              0
Finally, lets test see if airquality dataset has any missing data:
##     Ozone Solar.R Wind Temp Month Day Index
## 5      NA      NA 14.3   56     5   5     5
## 6      28      NA 14.9   66     5   6     6
## 10     NA     194  8.6   69     5  10    10
## 11      7      NA  6.9   74     5  11    11
## 25     NA      66 16.6   57     5  25    25
## 26     NA     266 14.9   58     5  26    26
## 27     NA      NA  8.0   57     5  27    27
## 32     NA     286  8.6   78     6   1    32
## 33     NA     287  9.7   74     6   2    33
## 34     NA     242 16.1   67     6   3    34
## 35     NA     186  9.2   84     6   4    35
## 36     NA     220  8.6   85     6   5    36
## 37     NA     264 14.3   79     6   6    37
## 39     NA     273  6.9   87     6   8    39
## 42     NA     259 10.9   93     6  11    42
## 43     NA     250  9.2   92     6  12    43
## 45     NA     332 13.8   80     6  14    45
## 46     NA     322 11.5   79     6  15    46
## 52     NA     150  6.3   77     6  21    52
## 53     NA      59  1.7   76     6  22    53
## 54     NA      91  4.6   76     6  23    54
## 55     NA     250  6.3   76     6  24    55
## 56     NA     135  8.0   75     6  25    56
## 57     NA     127  8.0   78     6  26    57
## 58     NA      47 10.3   73     6  27    58
## 59     NA      98 11.5   80     6  28    59
## 60     NA      31 14.9   77     6  29    60
## 61     NA     138  8.0   83     6  30    61
## 65     NA     101 10.9   84     7   4    65
## 72     NA     139  8.6   82     7  11    72
## 75     NA     291 14.9   91     7  14    75
## 83     NA     258  9.7   81     7  22    83
## 84     NA     295 11.5   82     7  23    84
## 96     78      NA  6.9   86     8   4    96
## 97     35      NA  7.4   85     8   5    97
## 98     66      NA  4.6   87     8   6    98
## 102    NA     222  8.6   92     8  10   102
## 103    NA     137 11.5   86     8  11   103
## 107    NA      64 11.5   79     8  15   107
## 115    NA     255 12.6   75     8  23   115
## 119    NA     153  5.7   88     8  27   119
## 150    NA     145 13.2   77     9  27   150