Using numeric_plots
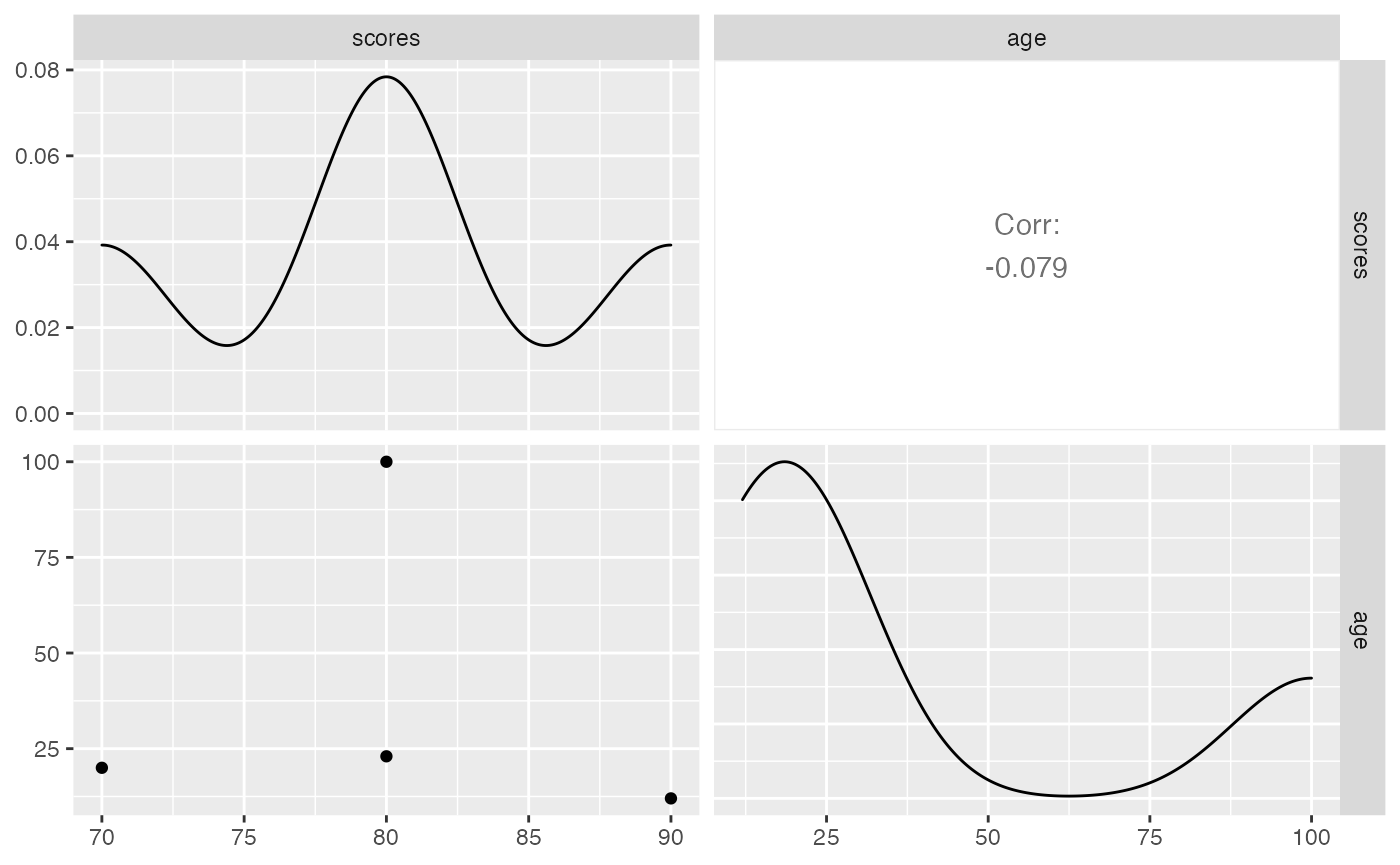
numeric_plots-vignette.Rmdnumeric_plots takes a dataframe and plots the possible pairs of the numeric columns using Altair, creating a matrix of correlation scattered plots. To use numeric_plots in a project:
library(EDAhelperR)Generate a matrix of scattered plots
df <- data.frame(names=c("Vera", "Jennifer", "Rowan", "Steven"),
  scores =c(90, 80, 70, 80),
  age=c(12, 23, 20, 100))

numeric_plots(df)