Using plot_histogram
plot_histogram-vignette.Rmd
library(EDAhelperR)
data <- iris
Create histograms for all numeric columns
The function plot_histogram will generate histograms for all numeric columns in a given data frame by default.
plot_histogram(data)
#> Warning: Use of `plot_data$value` is discouraged. Use `value` instead.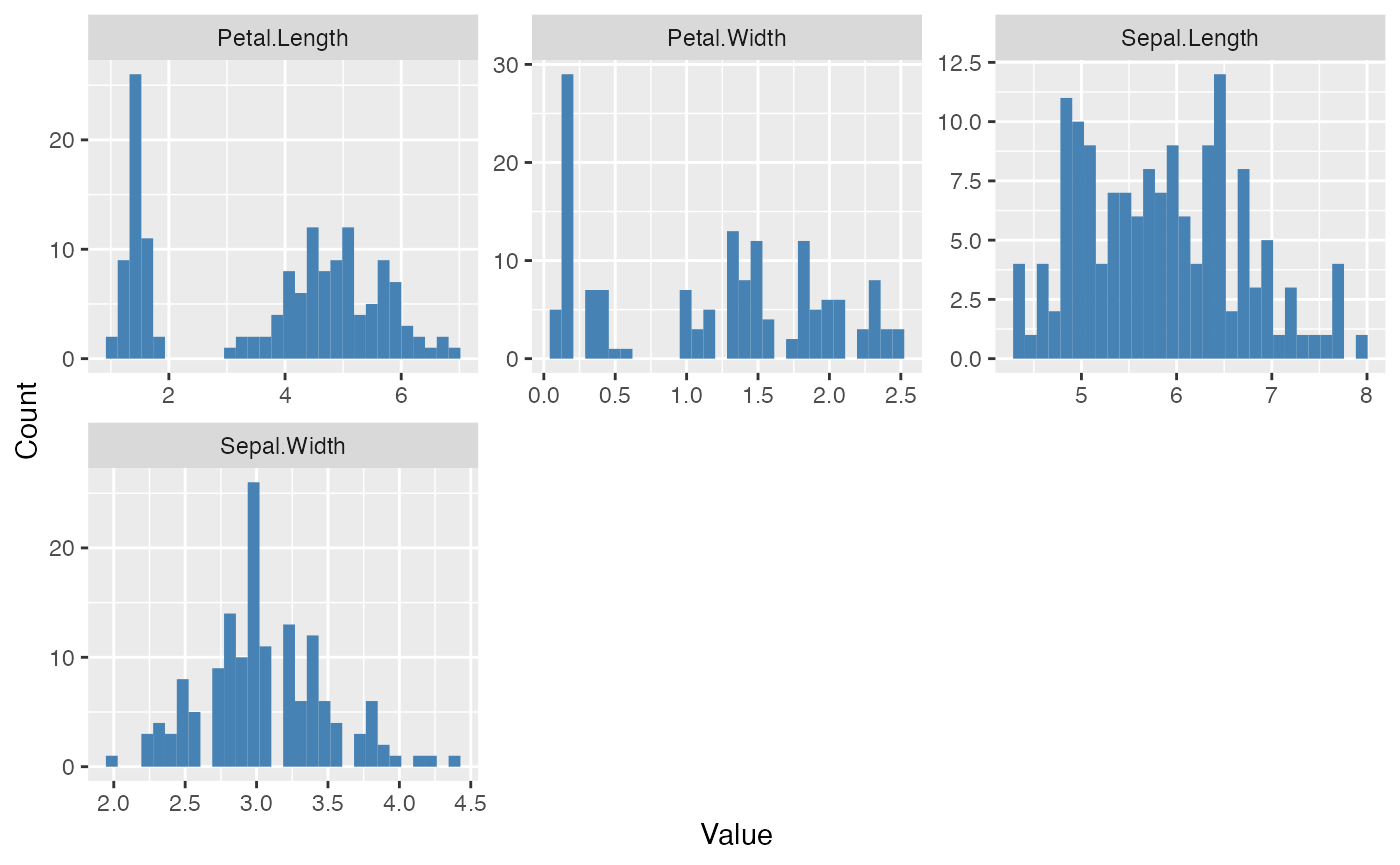
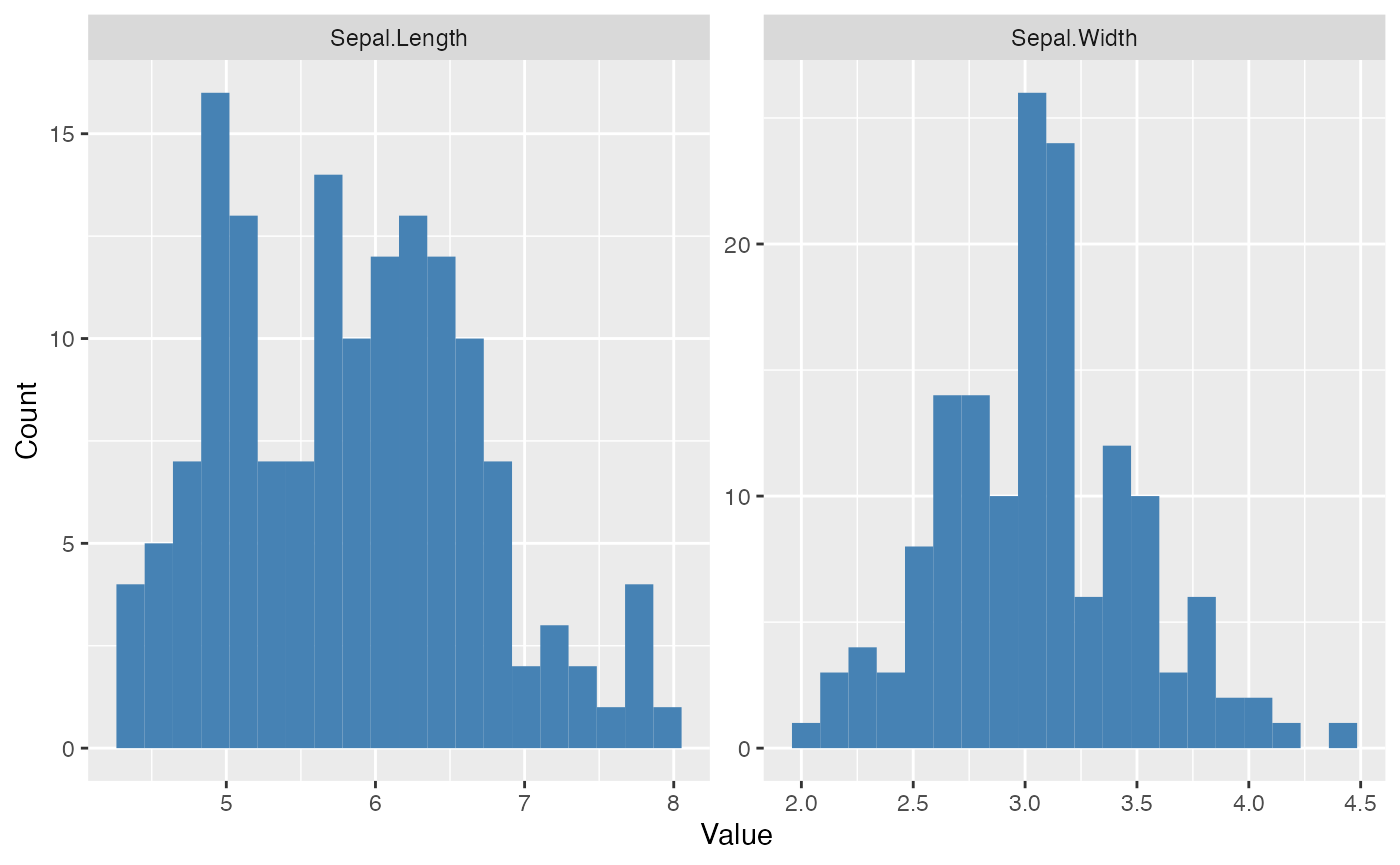
Create histogram for specific columns
Specific columns in the data frame can be plotted by assigning a character vector of column names to the columns argument.
plot_histogram(data, columns = c("Sepal.Length", "Sepal.Width"))
#> Warning: Use of `plot_data$value` is discouraged. Use `value` instead.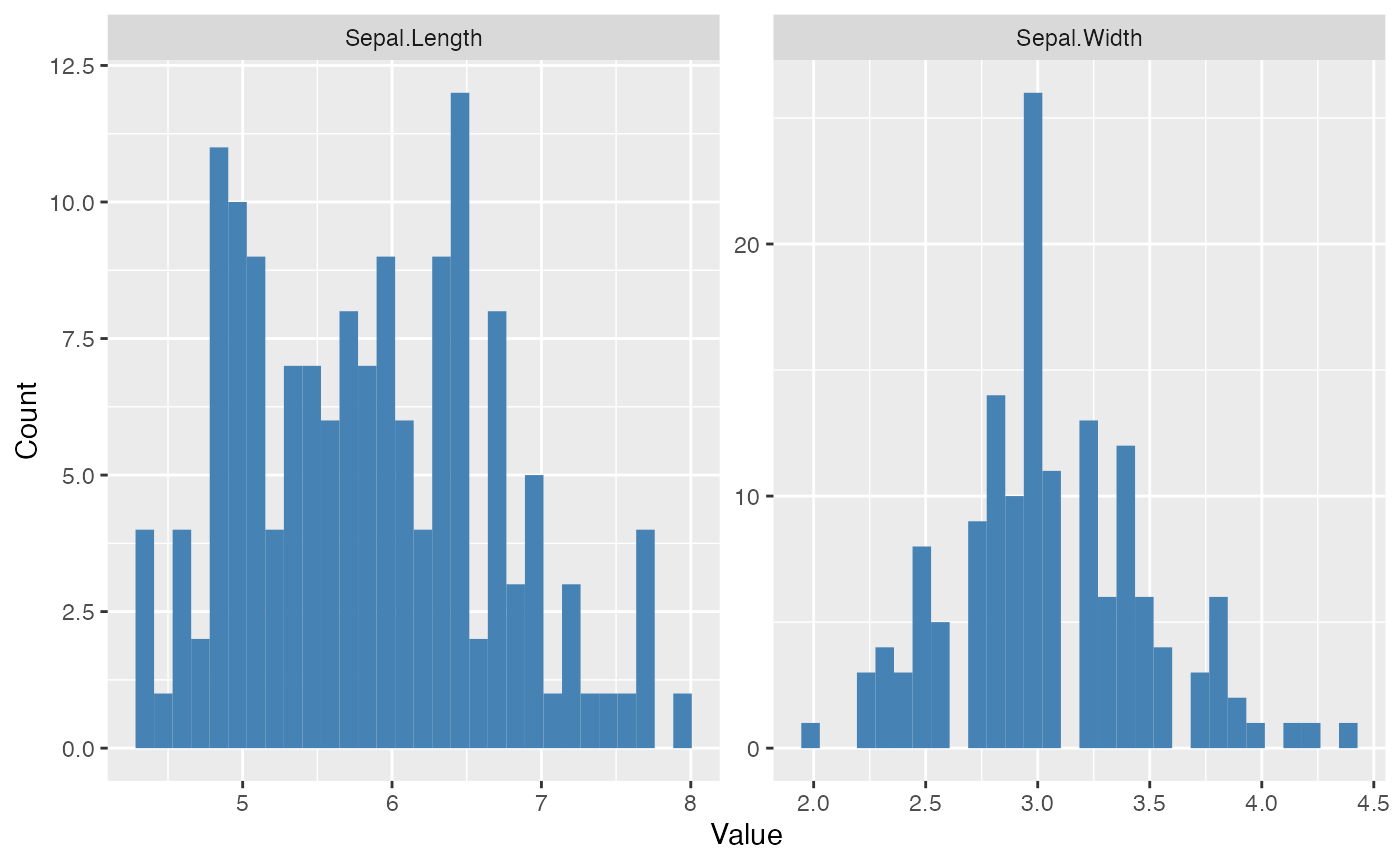
Adjust number of bins on plot
The number of bins on the plot can be adjusted by providing a numeric value to the num_bins argument.
plot_histogram(data, columns = c("Sepal.Length", "Sepal.Width"), num_bins = 20)
#> Warning: Use of `plot_data$value` is discouraged. Use `value` instead.