Creates histograms for numerical features within a dataframe using ggplot2
plot_histogram.RdCreates histograms for numerical features within a dataframe using ggplot2
plot_histogram(data, columns = "all", num_bins = 30)Arguments
- data
A dataframe
- columns
A list of numerical features for which to create histograms, or by default, plots all numerical features in the dataframe.
- num_bins
Integer. Number of bins per histogram plot, default is 30 bins.
Value
ggplot object
Examples
plot_histogram(iris)
#> Warning: Use of `plot_data$value` is discouraged. Use `value` instead.
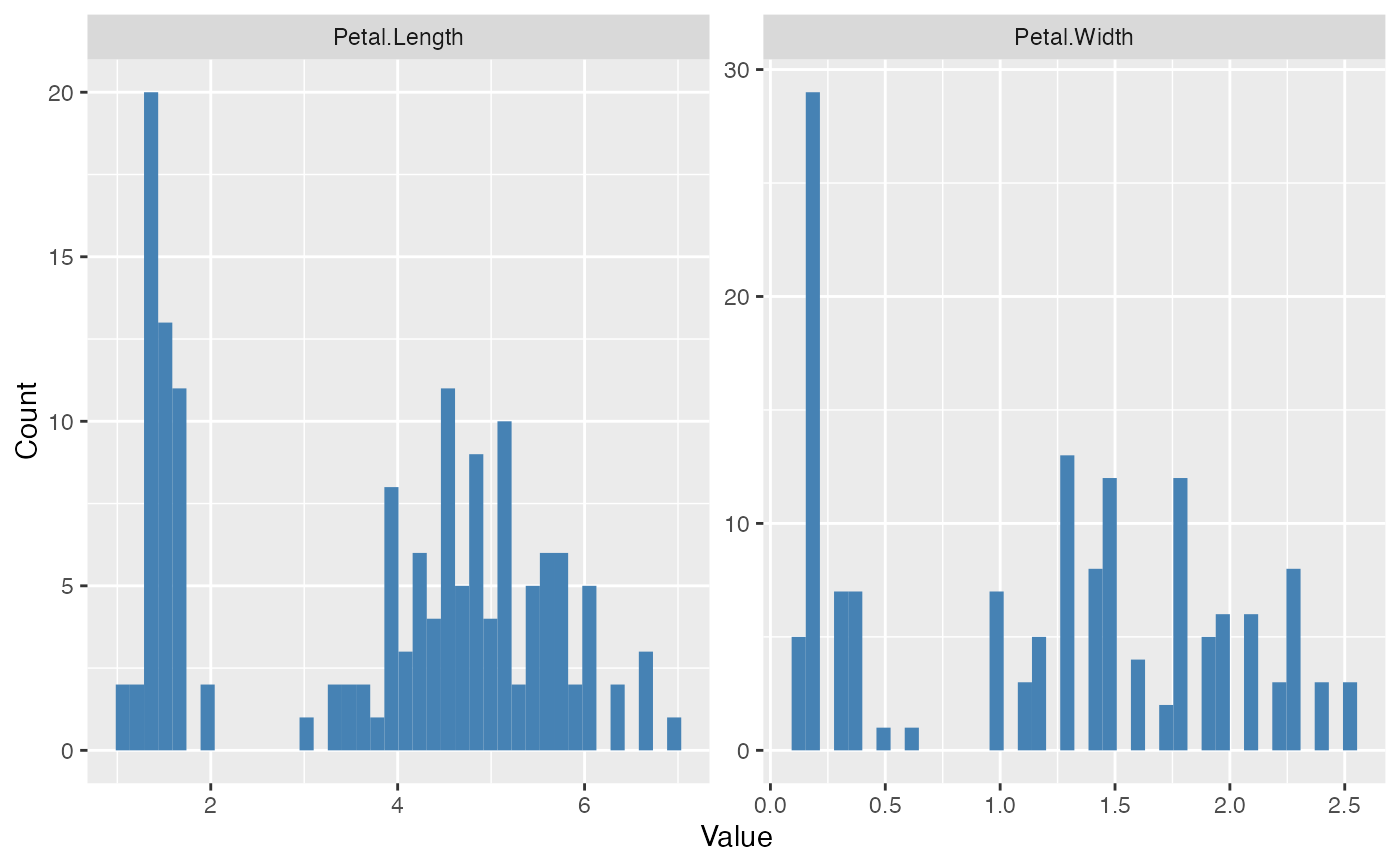
 plot_histogram(iris, columns = c("Petal.Length", "Petal.Width"), num_bins = 40)
#> Warning: Use of `plot_data$value` is discouraged. Use `value` instead.
plot_histogram(iris, columns = c("Petal.Length", "Petal.Width"), num_bins = 40)
#> Warning: Use of `plot_data$value` is discouraged. Use `value` instead.