import seaborn as sns
# load the tips dataset
tips = sns.load_dataset('tips')
# default values from data (will come from widgets later)
total_lower = tips.total_bill.min()
total_upper = tips.total_bill.max()
time_selected = tips.time.unique().tolist()
# filter by bill amount range
idx1 = tips.total_bill.between(
left=total_lower,
right=total_upper,
inclusive="both",
)
# filter by meal time
idx2 = tips.time.isin(time_selected)
# combine filters
tips_filtered = tips[idx1 & idx2]Tips Dashboard
title: Build a dashboard
What do you see?
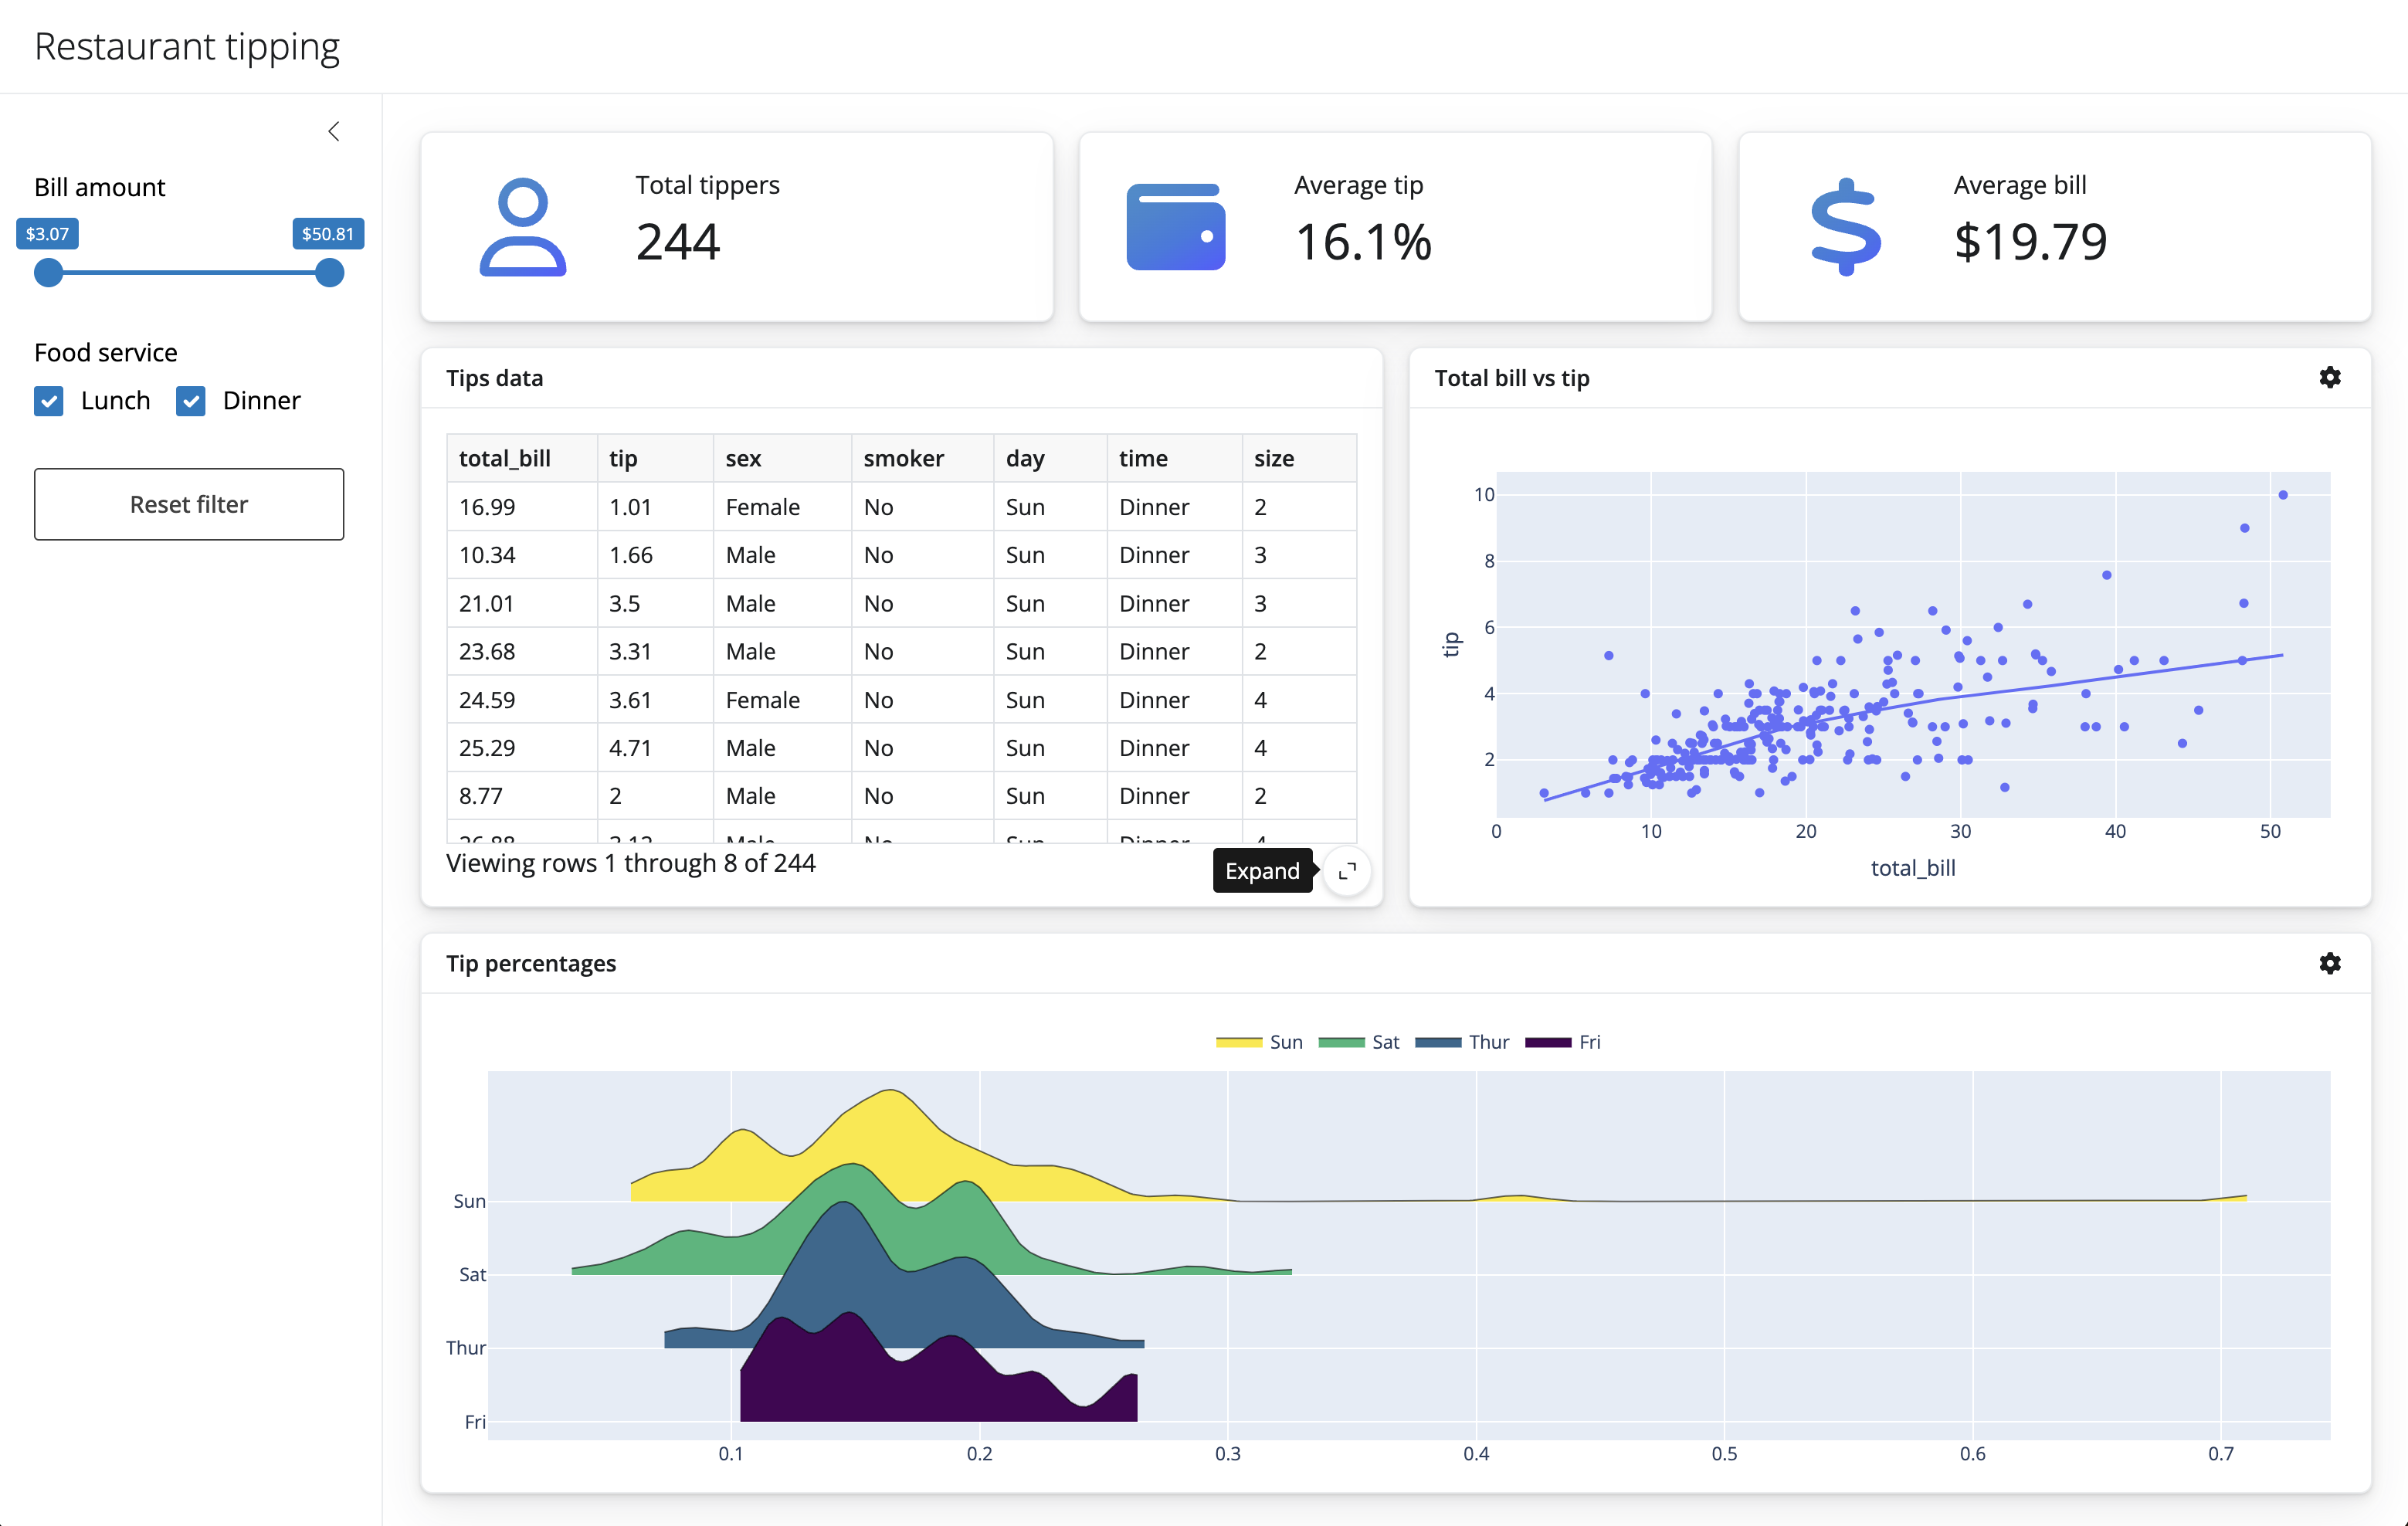
Restaurant Tipping dashboard
- Title: “Restaurant tipping”
- You can use the
ui.panel_title()and pass in atitle=''parameter
- You can use the
. . .
- Sidebar for a few input components (we’ll add those later)
- You can put some text here as a place holder, e.g.,
"sidebar inputs"
- You can put some text here as a place holder, e.g.,
. . .
- A full width column with 3 value boxes
- Each value box will take up the same width of space
- The value boxes will have separate labels and corresponding summary statistic
. . .
- A full width column with 2 cards, one for a dataframe and another for a scatter plot
- Each card will share the same width of space
. . .
- A full width column with 1 card
App UI components
Here are the documentation pages for functions that may be useful for this exercise:
Core API docs: https://shiny.posit.co/py/api/core/
ui.page_fillable(): https://shiny.posit.co/py/api/core/ui.page_fillable.html- many more
ui.page_*layouts
- many more
ui.sidebar(): https://shiny.posit.co/py/api/core/ui.sidebar.htmlui.layout_columns(): https://shiny.posit.co/py/api/core/ui.layout_columns.htmlui.card(): https://shiny.posit.co/py/api/core/ui.card.htmlui.card_header(): https://shiny.posit.co/py/api/core/ui.card_header.html
App UI
#| '!! shinylive warning !!': |
#|   shinylive does not work in self-contained HTML documents.
#|   Please set `embed-resources: false` in your metadata.
#| standalone: true
#| #| components: [editor, viewer]
#| layout: horizontal
#| viewerHeight: 500

from shiny import App, ui

# UI
app_ui = ui.page_fillable(
    ui.panel_title("Restaurant tipping"),
    ui.layout_sidebar(
        ui.sidebar("sidebar inputs", open="desktop"),
        ui.layout_columns(
            ui.value_box("Total tippers", "Value 1"),
            ui.value_box("Average tip", "Value 2"),
            ui.value_box("Average bill", "Value 3"),
            fill=False,
        ),
        ui.layout_columns(
            ui.card(ui.card_header("Tips data"), full_screen=True),
            ui.card(ui.card_header("Total bill vs tip"), full_screen=True),
            col_widths=[6, 6],
        ),
        ui.layout_columns(ui.card(ui.card_header("Tip percentages"), full_screen=True)),
    ),
)


# Server
def server(input, output, session):
    pass


# Create app
app = App(app_ui, server)
Add input components
from shiny import App, ui

app_ui = ui.page_fillable(
    ui.panel_title("Restaurant tipping"),
    ui.layout_sidebar(
        ui.sidebar(
            ui.input_slider(
                id="slider",
                label="Bill amount",
                min=0,
                max=100,
                value=[0, 100],
            ),
            ui.input_checkbox_group(
                id="checkbox_group",
                label="Food service",
                choices={
                    "Lunch": "Lunch",
                    "Dinner": "Dinner",
                },
                selected=[
                    "Lunch",
                    "Dinner",
                ],
            ),
            ui.input_action_button("action_button", "Reset filter"),
            open="desktop",
        ),
        ...
    ),
)

def server(input, output, session):
    pass

app = App(app_ui, server)
#| '!! shinylive warning !!': |
#| shinylive does not work in self-contained HTML documents.
#| Please set `embed-resources: false` in your metadata.
#| standalone: true
#| components: [viewer]
#| viewerHeight: 500
from shiny import App, ui
app_ui = ui.page_fillable(
ui.panel_title("Restaurant tipping"),
ui.layout_sidebar(
ui.sidebar(
ui.input_slider(
id="slider",
label="Bill amount",
min=0,
max=100,
value=[0, 100],
),
ui.input_checkbox_group(
id="checkbox_group",
label="Food service",
choices={
"Lunch": "Lunch",
"Dinner": "Dinner",
},
selected=[
"Lunch",
"Dinner",
],
),
ui.input_action_button("action_button", "Reset filter"),
open="desktop",
),
ui.layout_columns(
ui.value_box("Total tippers", "Value 1"),
ui.value_box("Average tip", "Value 2"),
ui.value_box("Average bill", "Value 3"),
fill=False,
),
ui.layout_columns(
ui.card(ui.card_header("Tips by day"), full_screen=True),
ui.card(ui.card_header("Total bill vs tip"), full_screen=True),
col_widths=[6, 6],
),
ui.layout_columns(
ui.card(ui.card_header("Tip percentages"), full_screen=True),
),
),
)
def server(input, output, session):
pass
app = App(app_ui, server)Let’s add some data
Calculate values
# tips_filtered is the dataset after applying
# slider (bill range) and checkbox (meal time) filters.
# These will be the values for our 3 value boxes.

# total tippers
total_tippers = tips_filtered.shape[0]
print(total_tippers)

# average tip as a percentage of the bill
perc = tips_filtered.tip / tips_filtered.total_bill
average_tip = f"{perc.mean():.1%}"
print(average_tip)

# average bill formatted as currency
bill = tips_filtered.total_bill.mean()
average_bill = f"${bill:.2f}"
print(average_bill)
244
16.1%
$19.79Add output placeholders to the UI
Before: static strings
ui.value_box("Total tippers", "Value 1"),
ui.value_box("Average tip", "Value 2"),
ui.value_box("Average bill", "Value 3"),
After: output placeholders — Shiny will fill these from the server (loading until we wire them up)
#| '!! shinylive warning !!': |
#| shinylive does not work in self-contained HTML documents.
#| Please set `embed-resources: false` in your metadata.
#| standalone: true
#| components: [viewer]
#| viewerHeight: 500
import seaborn as sns
from shiny import App, render, ui
tips = sns.load_dataset("tips")
app_ui = ui.page_fillable(
ui.panel_title("Restaurant tipping"),
ui.layout_sidebar(
ui.sidebar(
ui.input_slider(
id="slider",
label="Bill amount",
min=tips.total_bill.min(),
max=tips.total_bill.max(),
value=[tips.total_bill.min(), tips.total_bill.max()],
),
ui.input_checkbox_group(
id="checkbox_group",
label="Food service",
choices={
"Lunch": "Lunch",
"Dinner": "Dinner",
},
selected=[
"Lunch",
"Dinner",
],
),
ui.input_action_button("action_button", "Reset filter"),
open="desktop",
),
ui.layout_columns(
ui.value_box("Total tippers", ui.output_text("total_tippers")),
ui.value_box("Average tip", ui.output_text("average_tip")),
ui.value_box("Average bill", ui.output_text("average_bill")),
fill=False,
),
),
)
def server(input, output, session):
    pass
app = App(app_ui, server)Wire up the server
Before: empty server
def server(input, output, session):
passAfter: @render.text function name matches ui.output_text("id")
def server(input, output, session):
    @render.text
    def total_tippers():
        idx1 = tips.total_bill.between(
            left=input.slider()[0], right=input.slider()[1], inclusive="both")
        idx2 = tips.time.isin(input.checkbox_group())
        tips_filtered = tips[idx1 & idx2]
        return str(tips_filtered.shape[0])

    @render.text
    def average_tip():
        idx1 = tips.total_bill.between(
            left=input.slider()[0], right=input.slider()[1], inclusive="both")
        idx2 = tips.time.isin(input.checkbox_group())
        tips_filtered = tips[idx1 & idx2]
        return f"{(tips_filtered.tip / tips_filtered.total_bill).mean():.1%}"

    @render.text
    def average_bill():
        idx1 = tips.total_bill.between(
            left=input.slider()[0], right=input.slider()[1], inclusive="both")
        idx2 = tips.time.isin(input.checkbox_group())
        tips_filtered = tips[idx1 & idx2]
        return f"${tips_filtered.total_bill.mean():.2f}"
#| '!! shinylive warning !!': |
#| shinylive does not work in self-contained HTML documents.
#| Please set `embed-resources: false` in your metadata.
#| standalone: true
#| components: [viewer]
#| viewerHeight: 600
import seaborn as sns
from shiny import App, reactive, render, ui
tips = sns.load_dataset("tips")
app_ui = ui.page_fillable(
ui.panel_title("Restaurant tipping"),
ui.layout_sidebar(
ui.sidebar(
ui.input_slider(
id="slider",
label="Bill amount",
min=tips.total_bill.min(),
max=tips.total_bill.max(),
value=[tips.total_bill.min(), tips.total_bill.max()],
),
ui.input_checkbox_group(
id="checkbox_group",
label="Food service",
choices={
"Lunch": "Lunch",
"Dinner": "Dinner",
},
selected=[
"Lunch",
"Dinner",
],
),
ui.input_action_button("action_button", "Reset filter"),
open="desktop",
),
ui.layout_columns(
ui.value_box("Total tippers", ui.output_text("total_tippers")),
ui.value_box("Average tip", ui.output_text("average_tip")),
ui.value_box("Average bill", ui.output_text("average_bill")),
fill=False,
),
),
)
def server(input, output, session):
@render.text
def total_tippers():
idx1 = tips.total_bill.between(
left=input.slider()[0], right=input.slider()[1], inclusive="both")
idx2 = tips.time.isin(input.checkbox_group())
tips_filtered = tips[idx1 & idx2]
return str(tips_filtered.shape[0])
@render.text
def average_tip():
idx1 = tips.total_bill.between(
left=input.slider()[0], right=input.slider()[1], inclusive="both")
idx2 = tips.time.isin(input.checkbox_group())
tips_filtered = tips[idx1 & idx2]
perc = tips_filtered.tip / tips_filtered.total_bill
return f"{perc.mean():.1%}"
@render.text
def average_bill():
idx1 = tips.total_bill.between(
left=input.slider()[0], right=input.slider()[1], inclusive="both")
idx2 = tips.time.isin(input.checkbox_group())
tips_filtered = tips[idx1 & idx2]
bill = tips_filtered.total_bill.mean()
return f"${bill:.2f}"
app = App(app_ui, server)# UI placeholder inside the card
ui.card(
ui.card_header("Tip percentages"),
output_widget("ridge"),
full_screen=True,
),# Server function — same ridgeplot code, now using filtered_data()
@render_widget
def ridge():
df = filtered_data().copy()
df["percent"] = df.tip / df.total_bill
uvals = df.day.unique()
samples = [[df.percent[df.day == val]] for val in uvals]
plt = ridgeplot(
samples=samples,
labels=uvals,
bandwidth=0.01,
colorscale="viridis",
colormode="row-index",
)
plt.update_layout(
legend=dict(
orientation="h", yanchor="bottom", y=1.02, xanchor="center", x=0.5
)
)
return pltThe application (Core)
#| '!! shinylive warning !!': |
#|   shinylive does not work in self-contained HTML documents.
#|   Please set `embed-resources: false` in your metadata.
#| standalone: true
#| components: [editor, viewer]
#| layout: horizontal
#| viewerHeight: 500
from shiny import App, reactive, render, ui

app_ui = ui.page_fillable(
    ui.input_slider("bill", "Bill amount ($)", min=1, max=100, value=25),
    ui.output_text("tip_inline"),
    ui.output_text("tip_from_calc"),
)


def server(input, output, session):
    @render.text
    def tip_inline():
        """Computed directly from input."""
        return f"Tip (15%) [tip_inline]: ${input.bill() * 0.15:.2f}"

    @reactive.calc
    def tip_amount():
        """Saved for reuse."""
        return input.bill() * 0.15

    @render.text
    def tip_from_calc():
        """Uses saved @reactive.calc."""
        return f"Tip (saved) [tip_from_calc]: ${tip_amount():.2f}"


app = App(app_ui, server)
from shiny import App, render, ui, reactive
import plotly.express as px
from ridgeplot import ridgeplot
import seaborn as sns
from shinywidgets import render_plotly, render_widget, output_widget
tips = sns.load_dataset("tips")
# UI
app_ui = ui.page_fluid(
ui.tags.style("body { font-size: 0.6em; }"),
ui.panel_title("Restaurant tipping"),
ui.layout_sidebar(
ui.sidebar(
ui.input_slider(
id="slider",
label="Bill amount",
min=tips.total_bill.min(),
max=tips.total_bill.max(),
value=[tips.total_bill.min(), tips.total_bill.max()],
),
ui.input_checkbox_group(
id="checkbox_group",
label="Food service",
choices={
"Lunch": "Lunch",
"Dinner": "Dinner",
},
selected=[
"Lunch",
"Dinner",
],
),
ui.input_action_button("action_button", "Reset filter"),
open="desktop",
),
ui.layout_columns(
ui.value_box("Total tippers", ui.output_text("total_tippers")),
ui.value_box("Average tip", ui.output_text("average_tip")),
ui.value_box("Average bill", ui.output_text("average_bill")),
fill=False,
),
ui.layout_columns(
ui.card(
ui.card_header("Tips by day"),
ui.output_data_frame("tips_data"),
full_screen=True,
),
ui.card(
ui.card_header("Total bill vs tip"),
output_widget("scatterplot"),
full_screen=True,
),
col_widths=[6, 6],
),
ui.layout_columns(
ui.card(
ui.card_header("Tip percentages"),
output_widget("ridge"),
full_screen=True,
)
),
),
)
[`tip_amount()` is computed once and cached - multiple outputs (`tip_from_calc`, `total_from_calc`) reuse the same result instead of recalculating]{style="font-size: 0.6em;"}
```{shinylive-python}
#| standalone: true
#| components: [editor, viewer]
#| layout: horizontal
#| viewerHeight: 500
from shiny import App, reactive, render, ui
app_ui = ui.page_fillable(
ui.input_slider("bill", "Bill amount ($)", min=1, max=100, value=25),
ui.output_text("tip_inline"),
ui.output_text("tip_from_calc"),
ui.output_text("total_from_calc"),
ui.output_text("total_from_input"),
)
def server(input, output, session):
@render.text
def tip_inline():
"""Computed directly from input."""
return f"Tip (15%) [tip_inline]: ${input.bill() * 0.15:.2f}"
@reactive.calc
def tip_amount():
"""Saved for reuse."""
return input.bill() * 0.15
@render.text
def tip_from_calc():
"""Uses saved @reactive.calc."""
return f"Tip (saved) [tip_from_calc]: ${tip_amount():.2f}"
@render.text
def total_from_calc():
"""Builds on saved calc."""
return f"Total with tip [total_from_calc]: ${input.bill() + tip_amount():.2f}"
@render.text
def total_from_input():
"""Recalculates from scratch."""
return f"Total (recalc) [total_from_input]: ${input.bill() + input.bill() * 0.15:.2f}"
app = App(app_ui, server)Apply @reactive.calc to the dashboard
Same pattern as tip_amount() — filter once, reuse in all value boxes
Before: filtering repeated in every render function
def server(input, output, session):
    @render.text
    def total_tippers():
        idx1 = tips.total_bill.between(...)
        idx2 = tips.time.isin(...)
        tips_filtered = tips[idx1 & idx2]
        return str(tips_filtered.shape[0])

    @render.text
    def average_tip():
        idx1 = tips.total_bill.between(...)  # same
        idx2 = tips.time.isin(...)           # same
        tips_filtered = tips[idx1 & idx2]    # same
        ...
After: extract @reactive.calc, each render just uses filtered_data()
def server(input, output, session):
    @reactive.calc
    def filtered_data():
        idx1 = tips.total_bill.between(
            left=input.slider()[0], right=input.slider()[1], inclusive="both")
        idx2 = tips.time.isin(input.checkbox_group())
        return tips[idx1 & idx2]

    @render.text
    def total_tippers():
        return str(filtered_data().shape[0])

    @render.text
    def average_tip():
        perc = filtered_data().tip / filtered_data().total_bill
        return f"{perc.mean():.1%}"

    @render.text
    def average_bill():
        return f"${filtered_data().total_bill.mean():.2f}"
Dashboard with @reactive.calc
#| '!! shinylive warning !!': |
#|   shinylive does not work in self-contained HTML documents.
#|   Please set `embed-resources: false` in your metadata.
#| standalone: true
#| components: [editor, viewer]
#| layout: horizontal
#| viewerHeight: 500

import seaborn as sns
from shiny import App, reactive, render, ui

tips = sns.load_dataset("tips")

app_ui = ui.page_fillable(
    ui.panel_title("Restaurant tipping"),
    ui.layout_sidebar(
        ui.sidebar(
            ui.input_slider(
                id="slider",
                label="Bill amount",
                min=tips.total_bill.min(),
                max=tips.total_bill.max(),
                value=[tips.total_bill.min(), tips.total_bill.max()],
            ),
            ui.input_checkbox_group(
                id="checkbox_group",
                label="Food service",
                choices={"Lunch": "Lunch", "Dinner": "Dinner"},
                selected=["Lunch", "Dinner"],
            ),
            ui.input_action_button("action_button", "Reset filter"),
            open="desktop",
        ),
        ui.layout_columns(
            ui.value_box("Total tippers", ui.output_text("total_tippers")),
            ui.value_box("Average tip", ui.output_text("average_tip")),
            ui.value_box("Average bill", ui.output_text("average_bill")),
            fill=False,
        ),
    ),
)

def server(input, output, session):
    @reactive.calc
    def filtered_data():
        idx1 = tips.total_bill.between(
            left=input.slider()[0], right=input.slider()[1], inclusive="both")
        idx2 = tips.time.isin(input.checkbox_group())
        return tips[idx1 & idx2]

    @render.text
    def total_tippers():
        return str(filtered_data().shape[0])

    @render.text
    def average_tip():
        perc = filtered_data().tip / filtered_data().total_bill
        return f"{perc.mean():.1%}"

    @render.text
    def average_bill():
        return f"${filtered_data().total_bill.mean():.2f}"

app = App(app_ui, server)
Add data frame
/tmp/ipykernel_2741/3163269639.py:3: FutureWarning: The default of observed=False is deprecated and will be changed to True in a future version of pandas. Pass observed=False to retain current behavior or observed=True to adopt the future default and silence this warning.
df.groupby("day").agg(| day | count | avg_bill | avg_tip | avg_tip_pct | |
|---|---|---|---|---|---|
| 0 | Thur | 62 | 17.68 | 2.77 | 0.16 |
| 1 | Fri | 19 | 17.15 | 2.73 | 0.17 |
| 2 | Sat | 87 | 20.44 | 2.99 | 0.15 |
| 3 | Sun | 76 | 21.41 | 3.26 | 0.17 |
UI: ui.output_data_frame("id") — Server: @render.data_frame — Mutable objects
# UI placeholder inside the card
ui.card(
    ui.card_header("Tips by day"),
    ui.output_data_frame("tips_data"),
    full_screen=True,
),
# Server function — aggregate by day
@render.data_frame
def tips_data():
df = filtered_data().copy()
df["tip_pct"] = df.tip / df.total_bill
summary = df.groupby("day").agg(
count=("tip", "size"),
avg_bill=("total_bill", "mean"),
avg_tip=("tip", "mean"),
avg_tip_pct=("tip_pct", "mean"),
).round(2).reset_index()
return summaryScatterplot
Relationship between bill amount and tip with a smoothed trend
import plotly.express as px

px.scatter(
    tips_filtered,
    x="total_bill",
    y="tip",
    trendline="lowess"
)
Add the scatterplot
UI: output_widget("id") — Server: @render_plotly (from shinywidgets)
from shinywidgets import render_plotly, output_widget# UI placeholder inside the card
ui.card(
ui.card_header("Total bill vs tip"),
output_widget("scatterplot"),
full_screen=True,
),# Server function — same px.scatter(), now using filtered_data()
@render_plotly
def scatterplot():
return px.scatter(filtered_data(), x="total_bill", y="tip", trendline="lowess")Ridgeplot
Distribution of tip percentages broken out by day of the week
from ridgeplot import ridgeplot

tips_filtered["percent"] = tips_filtered.tip / tips_filtered.total_bill

uvals = tips_filtered.day.unique()
samples = [[tips_filtered.percent[tips_filtered.day == val]] for val in uvals]

plt = ridgeplot(
    samples=samples,
    labels=uvals,
    bandwidth=0.01,
    colorscale="viridis",
    colormode="row-index"
)

plt.update_layout(
    legend=dict(
        orientation="h",
        yanchor="bottom",
        y=1.02,
        xanchor="center",
        x=0.5
    )
)
Add the ridgeplot
UI: output_widget("id") — Server: @render_widget (from shinywidgets)
from shinywidgets import render_widget, output_widget# UI placeholder inside the card
ui.card(
ui.card_header("Tip percentages"),
output_widget("ridge"),
full_screen=True,
),# Server function — same ridgeplot code, now using filtered_data()
@render_widget
def ridge():
df = filtered_data().copy()
df["percent"] = df.tip / df.total_bill
uvals = df.day.unique()
samples = [[df.percent[df.day == val]] for val in uvals]
plt = ridgeplot(
samples=samples,
labels=uvals,
bandwidth=0.01,
colorscale="viridis",
colormode="row-index",
)
plt.update_layout(
legend=dict(
orientation="h", yanchor="bottom", y=1.02, xanchor="center", x=0.5
)
)
return pltThe application (Core)
#| '!! shinylive warning !!': |
#|   shinylive does not work in self-contained HTML documents.
#|   Please set `embed-resources: false` in your metadata.
#| standalone: true
#| components: [viewer]
#| viewerHeight: 600

## file: requirements.txt
ridgeplot
shinywidgets
statsmodels

## file: app.py
from shiny import App, render, ui, reactive
import plotly.express as px
from ridgeplot import ridgeplot
import seaborn as sns
from shinywidgets import render_plotly, render_widget, output_widget

tips = sns.load_dataset("tips")

# UI
app_ui = ui.page_fluid(
    ui.tags.style("body { font-size: 0.6em; }"),
    ui.panel_title("Restaurant tipping"),
    ui.layout_sidebar(
        ui.sidebar(
            ui.input_slider(
                id="slider",
                label="Bill amount",
                min=tips.total_bill.min(),
                max=tips.total_bill.max(),
                value=[tips.total_bill.min(), tips.total_bill.max()],
            ),
            ui.input_checkbox_group(
                id="checkbox_group",
                label="Food service",
                choices={
                    "Lunch": "Lunch",
                    "Dinner": "Dinner",
                },
                selected=[
                    "Lunch",
                    "Dinner",
                ],
            ),
            ui.input_action_button("action_button", "Reset filter"),
            open="desktop",
        ),
        ui.layout_columns(
            ui.value_box("Total tippers", ui.output_text("total_tippers")),
            ui.value_box("Average tip", ui.output_text("average_tip")),
            ui.value_box("Average bill", ui.output_text("average_bill")),
            fill=False,
        ),
        ui.layout_columns(
            ui.card(
                ui.card_header("Tips by day"),
                ui.output_data_frame("tips_data"),
                full_screen=True,
            ),
            ui.card(
                ui.card_header("Total bill vs tip"),
                output_widget("scatterplot"),
                full_screen=True,
            ),
            col_widths=[6, 6],
        ),
        ui.layout_columns(
            ui.card(
                ui.card_header("Tip percentages"),
                output_widget("ridge"),
                full_screen=True,
            )
        ),
    ),
)


# Server
def server(input, output, session):

    @reactive.calc
    def filtered_data():
        idx1 = tips.total_bill.between(
            left=input.slider()[0],
            right=input.slider()[1],
            inclusive="both",
        )
        idx2 = tips.time.isin(input.checkbox_group())
        tips_filtered = tips[idx1 & idx2]
        return tips_filtered

    @render.text
    def total_tippers():
        return str(filtered_data().shape[0])

    @render.text
    def average_tip():
        perc = filtered_data().tip / filtered_data().total_bill
        return f"{perc.mean():.1%}"

    @render.text
    def average_bill():
        bill = filtered_data().total_bill.mean()
        return f"${bill:.2f}"

    @render.data_frame
    def tips_data():
        df = filtered_data().copy()
        df["tip_pct"] = df.tip / df.total_bill
        summary = df.groupby("day").agg(
            count=("tip", "size"),
            avg_bill=("total_bill", "mean"),
            avg_tip=("tip", "mean"),
            avg_tip_pct=("tip_pct", "mean"),
        ).round(2).reset_index()
        return summary

    @render_plotly
    def scatterplot():
        return px.scatter(filtered_data(), x="total_bill", y="tip", trendline="lowess")

    @render_widget
    def ridge():
        df = filtered_data().copy()
        df["percent"] = df.tip / df.total_bill

        uvals = df.day.unique()
        samples = [[df.percent[df.day == val]] for val in uvals]

        plt = ridgeplot(
            samples=samples,
            labels=uvals,
            bandwidth=0.01,
            colorscale="viridis",
            colormode="row-index",
        )

        plt.update_layout(
            legend=dict(
                orientation="h", yanchor="bottom", y=1.02, xanchor="center", x=0.5
            )
        )

        return plt


# Create app
app = App(app_ui, server)
What we covered
- Layout:
page_fillable,layout_sidebar,layout_columns,card,value_box - Inputs:
input_slider,input_checkbox_group,input_action_button - Outputs:
@render.text,@render.data_frame,@render_plotly,@render_widget - Reactivity:
@reactive.calc— compute once, reuse everywhere - Mutable objects: always
.copy()before mutating a reactive value
Shiny for Python docs: https://shiny.posit.co/py/