
Lecture 02: Clustering class demo#

To run the code below, you need to install pytorch and torchvision in the course conda environment.
conda install pytorch torchvision -c pytorch
import numpy as np
import pandas as pd
import sys
import os
import torch, torchvision
from torchvision import datasets, models, transforms, utils
from PIL import Image
from torchvision import transforms
from torchvision.models import vgg16
import matplotlib.pyplot as plt
DATA_DIR = os.path.join(os.path.abspath(".."), "data/")
sys.path.append(os.path.join(os.path.abspath(".."), "code"))
from plotting_functions import *
---------------------------------------------------------------------------
ImportError                               Traceback (most recent call last)
Cell In[1], line 5
      3 import sys
      4 import os
----> 5 import torch, torchvision
      6 from torchvision import datasets, models, transforms, utils
      7 from PIL import Image

File ~/miniforge3/envs/jbook/lib/python3.12/site-packages/torch/__init__.py:367
    365     if USE_GLOBAL_DEPS:
    366         _load_global_deps()
--> 367     from torch._C import *  # noqa: F403
    370 class SymInt:
    371     """
    372     Like an int (including magic methods), but redirects all operations on the
    373     wrapped node. This is used in particular to symbolically record operations
    374     in the symbolic shape workflow.
    375     """

ImportError: dlopen(/Users/kvarada/miniforge3/envs/jbook/lib/python3.12/site-packages/torch/_C.cpython-312-darwin.so, 0x0002): Library not loaded: @rpath/libgfortran.5.dylib
  Referenced from: <0B9C315B-A1DD-3527-88DB-4B90531D343F> /Users/kvarada/miniforge3/envs/jbook/lib/libopenblas.0.dylib
  Reason: tried: '/Users/kvarada/miniforge3/envs/jbook/lib/libgfortran.5.dylib' (duplicate LC_RPATH '@loader_path'), '/Users/kvarada/miniforge3/envs/jbook/lib/libgfortran.5.dylib' (duplicate LC_RPATH '@loader_path'), '/Users/kvarada/miniforge3/envs/jbook/lib/libgfortran.5.dylib' (duplicate LC_RPATH '@loader_path'), '/Users/kvarada/miniforge3/envs/jbook/lib/libgfortran.5.dylib' (duplicate LC_RPATH '@loader_path'), '/Users/kvarada/miniforge3/envs/jbook/lib/libgfortran.5.dylib' (duplicate LC_RPATH '@loader_path'), '/Users/kvarada/miniforge3/envs/jbook/lib/libgfortran.5.dylib' (duplicate LC_RPATH '@loader_path'), '/Users/kvarada/miniforge3/envs/jbook/lib/libgfortran.5.dylib' (duplicate LC_RPATH '@loader_path'), '/Users/kvarada/miniforge3/envs/jbook/lib/libgfortran.5.dylib' (duplicate LC_RPATH '@loader_path'), '/Users/kvarada/miniforge3/envs/jbook/lib/python3.12/site-packages/torch/lib/libgfortran.5.dylib' (no such file), '/Users/kvarada/miniforge3/envs/jbook/lib/python3.12/site-packages/torch/../../../libgfortran.5.dylib' (duplicate LC_RPATH '@loader_path'), '/Users/kvarada/miniforge3/envs/jbook/lib/python3.12/site-packages/torch/lib/libgfortran.5.dylib' (no such file), '/Users/kvarada/miniforge3/envs/jbook/lib/python3.12/site-packages/torch/../../../libgfortran.5.dylib' (duplicate LC_RPATH '@loader_path'), '/Users/kvarada/miniforge3/envs/jbook/bin/../lib/libgfortran.5.dylib' (duplicate LC_RPATH '@loader_path'), '/Users/kvarada/miniforge3/envs/jbook/bin/../lib/libgfortran.5.dylib' (duplicate LC_RPATH '@loader_path'), '/usr/local/lib/libgfortran.5.dylib' (no such file), '/usr/lib/libgfortran.5.dylib' (no such file, not in dyld cache)
Hierarchical clustering on recipes dataset#
Let’s create a dendrogram on a more realistic dataset.
We’ll use Kaggle’s Food.com recipes corpus. This corpus contains 180K+ recipes and 700K+ recipe reviews. In this lab, we’ll only focus on recipes and not on reviews. The recipes are present in RAW_recipes.csv. Our goal is to find categories or groupings of recipes from this corpus based on their names.
orig_recipes_df = pd.read_csv(DATA_DIR + "RAW_recipes.csv")
orig_recipes_df.shape
(231637, 12)
def get_recipes_sample(orig_recipes_df, n_tags=300, min_len=5):
    orig_recipes_df = orig_recipes_df.dropna()  # Remove rows with NaNs.
    orig_recipes_df = orig_recipes_df.drop_duplicates(
        "name"
    )  # Remove rows with duplicate names.
    orig_recipes_df = orig_recipes_df[orig_recipes_df["name"].apply(len) >= min_len] # Remove rows where recipe names are too short (< 5 characters).
    first_n = orig_recipes_df["tags"].value_counts()[0:n_tags].index.tolist() # Only consider the rows where tags are one of the most frequent n tags.
    recipes_df = orig_recipes_df[orig_recipes_df["tags"].isin(first_n)]
    return recipes_df
recipes_df = get_recipes_sample(orig_recipes_df)
recipes_df.shape
(9100, 12)
recipes_df["name"]
42            i yam what i yam  muffins
101             to your health  muffins
129       250 00 chocolate chip cookies
138                       lplermagronen
163             california roll   salad
                      ...
231430      zucchini wheat germ cookies
231514         zucchini blueberry bread
231547           zucchini salsa burgers
231596                    zuppa toscana
231629                     zydeco salad
Name: name, Length: 9100, dtype: object
from sentence_transformers import SentenceTransformer
embedder = SentenceTransformer('all-MiniLM-L6-v2')
recipe_names = recipes_df["name"].tolist()
embeddings = embedder.encode(recipe_names)
recipe_names_embeddings = pd.DataFrame(
    embeddings,
    index=recipes_df.index,
)
recipe_names_embeddings
| 0 | 1 | 2 | 3 | 4 | 5 | 6 | 7 | 8 | 9 | ... | 374 | 375 | 376 | 377 | 378 | 379 | 380 | 381 | 382 | 383 | |
|---|---|---|---|---|---|---|---|---|---|---|---|---|---|---|---|---|---|---|---|---|---|
| 42 | 0.019592 | -0.088336 | 0.072677 | -0.034575 | -0.048741 | -0.049801 | 0.175334 | -0.055191 | 0.020301 | 0.019828 | ... | 0.063293 | -0.067171 | 0.087500 | -0.061550 | 0.039297 | -0.050147 | 0.027708 | 0.056843 | 0.056151 | -0.122506 |
| 101 | -0.000567 | -0.011825 | 0.073199 | 0.058175 | 0.031688 | -0.015428 | 0.168134 | 0.000466 | 0.033078 | -0.013923 | ... | -0.012926 | -0.015949 | 0.031315 | -0.059074 | 0.014143 | -0.047270 | 0.007844 | 0.035501 | 0.076061 | -0.078119 |
| 129 | -0.022604 | 0.065034 | -0.033065 | 0.014450 | -0.105039 | -0.050559 | 0.100076 | 0.022929 | -0.037398 | 0.011857 | ... | 0.007971 | -0.019165 | 0.004935 | 0.009005 | 0.000919 | -0.040078 | 0.008650 | -0.075781 | -0.083477 | -0.123240 |
| 138 | -0.066915 | 0.025988 | -0.087689 | -0.006847 | -0.012861 | 0.049035 | 0.035351 | 0.124966 | -0.011697 | -0.050179 | ... | -0.042345 | -0.005794 | -0.031800 | 0.120664 | -0.057335 | -0.077068 | 0.001653 | -0.048223 | 0.116455 | 0.021789 |
| 163 | -0.007068 | -0.007308 | -0.026629 | -0.004153 | -0.052810 | 0.011126 | 0.024000 | -0.036994 | 0.023526 | -0.046870 | ... | -0.018432 | 0.051918 | 0.036101 | -0.035312 | 0.005817 | 0.101802 | -0.063171 | -0.007917 | 0.089744 | 0.006997 |
| ... | ... | ... | ... | ... | ... | ... | ... | ... | ... | ... | ... | ... | ... | ... | ... | ... | ... | ... | ... | ... | ... |
| 231430 | -0.036366 | 0.087173 | -0.039641 | 0.002705 | 0.097142 | -0.075385 | 0.068207 | 0.010435 | -0.069214 | 0.010464 | ... | 0.050988 | -0.064541 | 0.090829 | -0.004570 | 0.079109 | 0.019663 | -0.058483 | -0.048723 | 0.019152 | -0.012266 |
| 231514 | -0.052718 | 0.008980 | -0.046014 | 0.030194 | 0.005201 | 0.009964 | -0.006760 | 0.030238 | -0.031474 | 0.024632 | ... | 0.075467 | 0.000967 | 0.085033 | -0.006520 | 0.031094 | 0.072901 | -0.094975 | -0.052466 | -0.003300 | -0.006991 |
| 231547 | -0.080801 | 0.004295 | -0.044325 | 0.038307 | -0.030125 | -0.063566 | 0.004788 | 0.004822 | 0.015525 | -0.040094 | ... | 0.066642 | 0.016605 | 0.096211 | -0.023969 | 0.045752 | 0.017091 | -0.062939 | -0.016950 | 0.012060 | 0.039776 |
| 231596 | -0.060801 | 0.111672 | -0.108755 | 0.052323 | -0.099851 | -0.027532 | 0.084190 | -0.004861 | 0.002891 | 0.013944 | ... | 0.038082 | -0.014214 | 0.048392 | 0.050377 | 0.015281 | 0.106766 | 0.032009 | 0.020113 | 0.004977 | -0.005828 |
| 231629 | -0.085059 | 0.009065 | -0.088442 | -0.008907 | 0.002234 | -0.055801 | 0.039431 | -0.037784 | 0.005315 | -0.078361 | ... | 0.063838 | 0.035654 | 0.031519 | -0.006411 | 0.007803 | 0.016261 | -0.006218 | 0.016956 | 0.019806 | -0.042820 |
9100 rows × 384 columns
def plot_dendrogram(Z, labels, w=15, h=20, p=10):
    fig, ax = plt.subplots(figsize=(w, h))
    dendrogram(
        Z,
        p=p,
        truncate_mode="level",
        orientation="left",
        leaf_font_size=12,
        labels=labels,
        ax=ax,
    )
    ax = plt.gca()
    ax.set_ylabel("Cluster distances", fontsize=w)
from scipy.cluster.hierarchy import dendrogram, linkage

recipe_names = recipes_df["name"].tolist()
Z = linkage(embeddings, method="complete", metric="cosine")
plot_dendrogram(Z, labels=recipe_names, w=15, h=230, p=10)

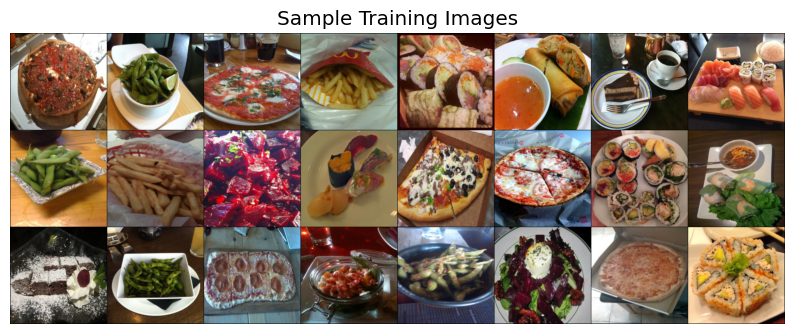
Let’s cluster images!!#
For this demo, I’m going to use the following image dataset:
A tiny subset of Food-101 from last lecture (available here).
A small subset of Human Faces dataset (available here).
Let’s start with small subset of birds dataset. You can experiment with a bigger dataset if you like.
device = torch.device("cuda:0" if torch.cuda.is_available() else "cpu")
import random
def set_seed(seed=42):
    torch.manual_seed(seed)
    np.random.seed(seed)
    random.seed(seed)
set_seed(seed=42)
import glob
IMAGE_SIZE = 224
def read_img_dataset(data_dir, BATCH_SIZE):
    data_transforms = transforms.Compose(
        [
            transforms.Resize((IMAGE_SIZE, IMAGE_SIZE)),
            transforms.ToTensor(),
            transforms.Normalize([0.5, 0.5, 0.5], [0.5, 0.5, 0.5]),
        ])

    image_dataset = datasets.ImageFolder(root=data_dir, transform=data_transforms)
    dataloader = torch.utils.data.DataLoader(
         image_dataset, batch_size=BATCH_SIZE, shuffle=True, num_workers=0
    )
    dataset_size = len(image_dataset)
    class_names = image_dataset.classes
    inputs, classes = next(iter(dataloader))
    return inputs, classes
def plot_sample_imgs(inputs):
    plt.figure(figsize=(10, 70)); plt.axis("off"); plt.title("Sample Training Images")
    plt.imshow(np.transpose(utils.make_grid(inputs, padding=1, normalize=True),(1, 2, 0)));
def get_features(model, inputs):
    """Extract output of densenet model"""
    model.eval()
    with torch.no_grad():  # turn off computational graph stuff
        Z = model(inputs).detach().numpy()
    return Z
densenet = models.densenet121(weights="DenseNet121_Weights.IMAGENET1K_V1")
densenet.classifier = torch.nn.Identity()  # remove that last "classification" layer
data_dir = "../data/food"
file_names = [image_file for image_file in glob.glob(data_dir + "/*/*.jpg")]
n_images = len(file_names)
BATCH_SIZE = n_images  # because our dataset is quite small
food_inputs, food_classes = read_img_dataset(data_dir, BATCH_SIZE)
n_images
350
X_food = food_inputs.numpy()
plot_sample_imgs(food_inputs[0:24,:,:,:])
Z_food = get_features(
    densenet, food_inputs,
)
Z_food.shape
(350, 1024)
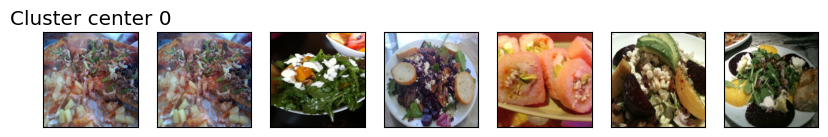
from sklearn.cluster import KMeans

k = 7
km = KMeans(n_clusters=k, n_init='auto', random_state=123)
km.fit(Z_food)
huggingface/tokenizers: The current process just got forked, after parallelism has already been used. Disabling parallelism to avoid deadlocks...
To disable this warning, you can either:
	- Avoid using `tokenizers` before the fork if possible
	- Explicitly set the environment variable TOKENIZERS_PARALLELISM=(true | false)
KMeans(n_clusters=7, random_state=123)In a Jupyter environment, please rerun this cell to show the HTML representation or trust the notebook.
On GitHub, the HTML representation is unable to render, please try loading this page with nbviewer.org.
KMeans(n_clusters=7, random_state=123)
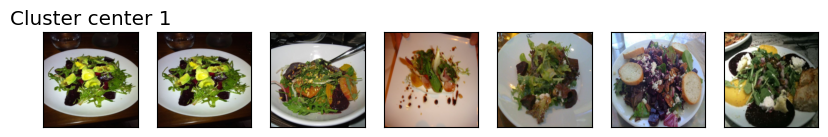
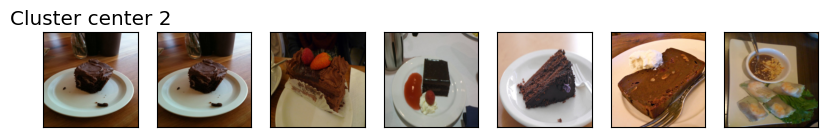
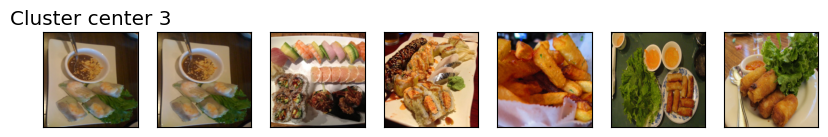
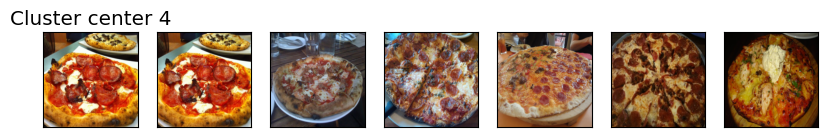
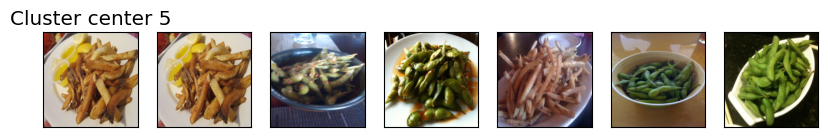
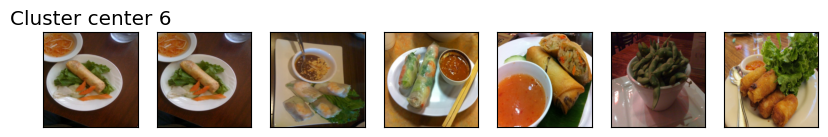
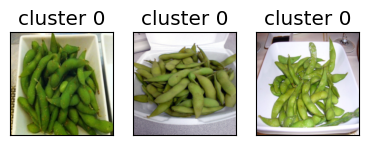
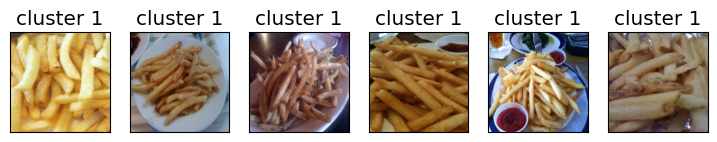
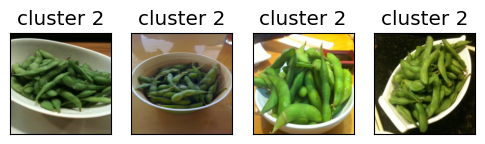
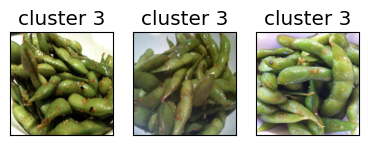
for cluster in range(k):
    get_cluster_images(km, Z_food, X_food, cluster, n_img=6)
82
Image indices:  [ 82 334 265  35 114 343]
276
Image indices:  [276 191 186  29 265 343]
161
Image indices:  [161 102 190 241  56  76]
76
Image indices:  [ 76  39 259 295 313 138]
124
Image indices:  [124 253  25  27 223 280]
214
Image indices:  [214  20 141 249 203 274]
48
Image indices:  [ 48  76  61   5  89 138]
Let’s try DBSCAN.
dbscan = DBSCAN()

labels = dbscan.fit_predict(Z_food)
print("Unique labels: {}".format(np.unique(labels)))
Unique labels: [-1]
It identified all points as noise points. Let’s explore the distances between points.
from sklearn.metrics.pairwise import euclidean_distances

dists = euclidean_distances(Z_food)
np.fill_diagonal(dists, np.inf)
dists_df = pd.DataFrame(dists)
dists_df
| 0 | 1 | 2 | 3 | 4 | 5 | 6 | 7 | 8 | 9 | ... | 340 | 341 | 342 | 343 | 344 | 345 | 346 | 347 | 348 | 349 | |
|---|---|---|---|---|---|---|---|---|---|---|---|---|---|---|---|---|---|---|---|---|---|
| 0 | inf | 27.170071 | 23.031963 | 29.344770 | 27.464485 | 25.905249 | 28.601198 | 27.226374 | 27.482910 | 27.221531 | ... | 27.895405 | 28.627741 | 28.157877 | 24.296236 | 27.864172 | 26.458879 | 28.636688 | 23.513239 | 26.565344 | 27.202259 |
| 1 | 27.170071 | inf | 22.623034 | 24.378839 | 25.491880 | 21.179726 | 25.291134 | 22.400309 | 17.118835 | 23.523659 | ... | 22.605665 | 19.422024 | 22.297949 | 20.873529 | 24.695156 | 23.107458 | 21.258495 | 19.471357 | 20.257633 | 22.101439 |
| 2 | 23.031963 | 22.623034 | inf | 28.764124 | 25.544821 | 23.159750 | 26.158792 | 23.423162 | 23.352556 | 25.552364 | ... | 26.763525 | 25.627256 | 27.411240 | 22.771511 | 24.695322 | 25.684532 | 26.029633 | 20.417009 | 21.786682 | 22.903080 |
| 3 | 29.344770 | 24.378839 | 28.764124 | inf | 28.520519 | 23.345842 | 28.131287 | 27.448313 | 24.425112 | 19.679516 | ... | 22.209080 | 26.940434 | 26.980894 | 25.166636 | 27.609039 | 21.547804 | 26.480219 | 24.750483 | 25.170492 | 26.520855 |
| 4 | 27.464485 | 25.491880 | 25.544821 | 28.520519 | inf | 21.172096 | 26.477964 | 23.458084 | 24.881807 | 26.123215 | ... | 26.482233 | 24.862644 | 26.194008 | 22.634832 | 26.464815 | 25.304211 | 25.343542 | 23.945749 | 23.584101 | 25.460316 |
| ... | ... | ... | ... | ... | ... | ... | ... | ... | ... | ... | ... | ... | ... | ... | ... | ... | ... | ... | ... | ... | ... |
| 345 | 26.458879 | 23.107458 | 25.684532 | 21.547804 | 25.304211 | 22.533875 | 26.831314 | 24.927710 | 22.792894 | 21.153376 | ... | 20.873131 | 24.183716 | 25.783266 | 23.444523 | 25.757412 | inf | 24.095852 | 22.627153 | 24.188885 | 24.653475 |
| 346 | 28.636688 | 21.258495 | 26.029633 | 26.480219 | 25.343542 | 21.611742 | 26.205795 | 25.979353 | 20.662205 | 23.817640 | ... | 22.648527 | 21.091988 | 21.743132 | 23.498381 | 27.345236 | 24.095852 | inf | 22.860329 | 24.492994 | 25.513124 |
| 347 | 23.513239 | 19.471357 | 20.417009 | 24.750483 | 23.945749 | 19.392572 | 23.914520 | 22.881351 | 20.868397 | 23.173370 | ... | 23.511862 | 23.249804 | 23.443993 | 17.126707 | 22.055302 | 22.627153 | 22.860329 | inf | 18.786024 | 18.716599 |
| 348 | 26.565344 | 20.257633 | 21.786682 | 25.170492 | 23.584101 | 19.035461 | 22.507225 | 21.890001 | 18.954798 | 24.086985 | ... | 24.703289 | 22.101406 | 23.019146 | 18.728836 | 22.244556 | 24.188885 | 24.492994 | 18.786024 | inf | 22.293304 |
| 349 | 27.202259 | 22.101439 | 22.903080 | 26.520855 | 25.460316 | 21.709145 | 24.901802 | 24.091793 | 23.649513 | 25.744673 | ... | 26.223894 | 25.669897 | 25.911024 | 18.624897 | 25.121590 | 24.653475 | 25.513124 | 18.716599 | 22.293304 | inf |
350 rows × 350 columns
dists.min(), np.nanmax(dists[dists != np.inf]), np.mean(dists[dists != np.inf])
(np.float32(10.06717), np.float32(36.652683), np.float32(24.538565))
for eps in range(13, 20):
    print("\neps={}".format(eps))
    dbscan = DBSCAN(eps=eps, min_samples=3)
    labels = dbscan.fit_predict(Z_food)
    print("Number of clusters: {}".format(len(np.unique(labels))))
    print("Cluster sizes: {}".format(np.bincount(labels + 1)))
eps=13
Number of clusters: 2
Cluster sizes: [347   3]

eps=14
Number of clusters: 5
Cluster sizes: [334   3   6   4   3]

eps=15
Number of clusters: 4
Cluster sizes: [299  26   8  17]

eps=16
Number of clusters: 4
Cluster sizes: [248  86   3  13]

eps=17
Number of clusters: 2
Cluster sizes: [205 145]

eps=18
Number of clusters: 2
Cluster sizes: [160 190]

eps=19
Number of clusters: 2
Cluster sizes: [116 234]
dbscan = DBSCAN(eps=14, min_samples=3)
dbscan_labels = dbscan.fit_predict(Z_food)
print("Number of clusters: {}".format(len(np.unique(dbscan_labels))))
print("Cluster sizes: {}".format(np.bincount(dbscan_labels + 1)))
print("Unique labels: {}".format(np.unique(dbscan_labels)))
Number of clusters: 5
Cluster sizes: [334   3   6   4   3]
Unique labels: [-1  0  1  2  3]
print_dbscan_clusters(Z_food, food_inputs, dbscan_labels)
Let’s examine noise points identified by DBSCAN.
print_dbscan_noise_images(Z_food, food_inputs, dbscan_labels)