Raw Voltage Visualization
Raw voltage plot

from simpl_eeg import raw_voltage, eeg_objects
Define parameters
A detailed description of all parameters can be found in the raw_voltage.plot_voltage docstring:
help(raw_voltage.plot_voltage)
Help on function plot_voltage in module simpl_eeg.raw_voltage:

plot_voltage(epoch, remove_xlabel=False, show_times=True, height=None, width=None, **kwargs)
    Generate raw voltage plot

    Parameters:
        epoch: mne.epochs.Epochs
            Epoch(s) to display
        remove_xlabel: bool (optional)
            Whether to remove the x-axis label. Defaults to False.
        show_times: bool (optional)
            Whether to show seconds on the x-axis. Defaults to True.
        height: float | None (optional)
            Height of the plot in inches. Defaults to None for automatic.
        width: float | None (optional)
            Width of the plot in inches. Defaults to None for automatic.
        **kwargs: dict (optional)
            Optional arguments to pass to mne.Epochs.plot()

            Full list of options available at
            https://mne.tools/stable/generated/mne.Epochs.html#mne.Epochs.plot

    Returns:
        matplotlib.figure.Figure:
            The raw voltage plot figure
# change values below to values of interest

experiment_path = "../../data/927"
nth_epoch = 0
Create epoched data
For additional options see Creating EEG Objects section.
epochs = eeg_objects.Epochs(experiment_path)
epoch = epochs.get_epoch(nth_epoch)
Reading /Users/mpin/Documents/MDS/capstone/simpl_eeg_capstone/data/927/fixica.fdt
/Users/mpin/Documents/MDS/capstone/simpl_eeg_capstone/simpl_eeg/eeg_objects.py:52: RuntimeWarning: Data file name in EEG.data (927 fix ica correct.fdt) is incorrect, the file name must have changed on disk, using the correct file name (fixica.fdt).
  self.raw = mne.io.read_raw_eeglab(folder_path+"/"+file_name+".set")
Not setting metadata
Not setting metadata
33 matching events found
Setting baseline interval to [-0.2998046875, 0.0] sec
Applying baseline correction (mode: mean)
0 projection items activated
Loading data for 33 events and 2049 original time points ...
0 bad epochs dropped
Create the raw voltage plot
Generating the plot
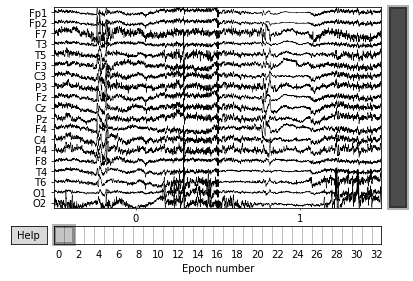
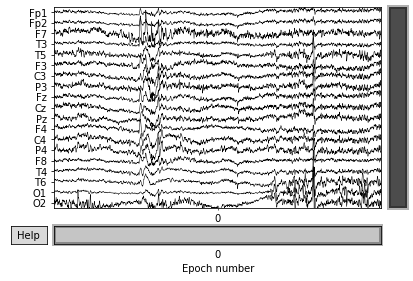
You can create a plot for one epoch or multiple epochs by customizing the epoch object you pass to the function.
# multiple epochs
raw_voltage.plot_voltage(epochs.all_epochs, n_epochs=2);
# single epoch
voltage_plot = raw_voltage.plot_voltage(epoch)
voltage_plot;
Saving the plot
You can change the file to different formats by changing the format argument in the function. It supports png, pdf, svg.
# change the file path to where you would like to save the file
file_path = "../../exports/examples/voltage_plot.svg"

voltage_plot.savefig(file_path, format="svg")