3D Head Visualizations
3D topographic head map
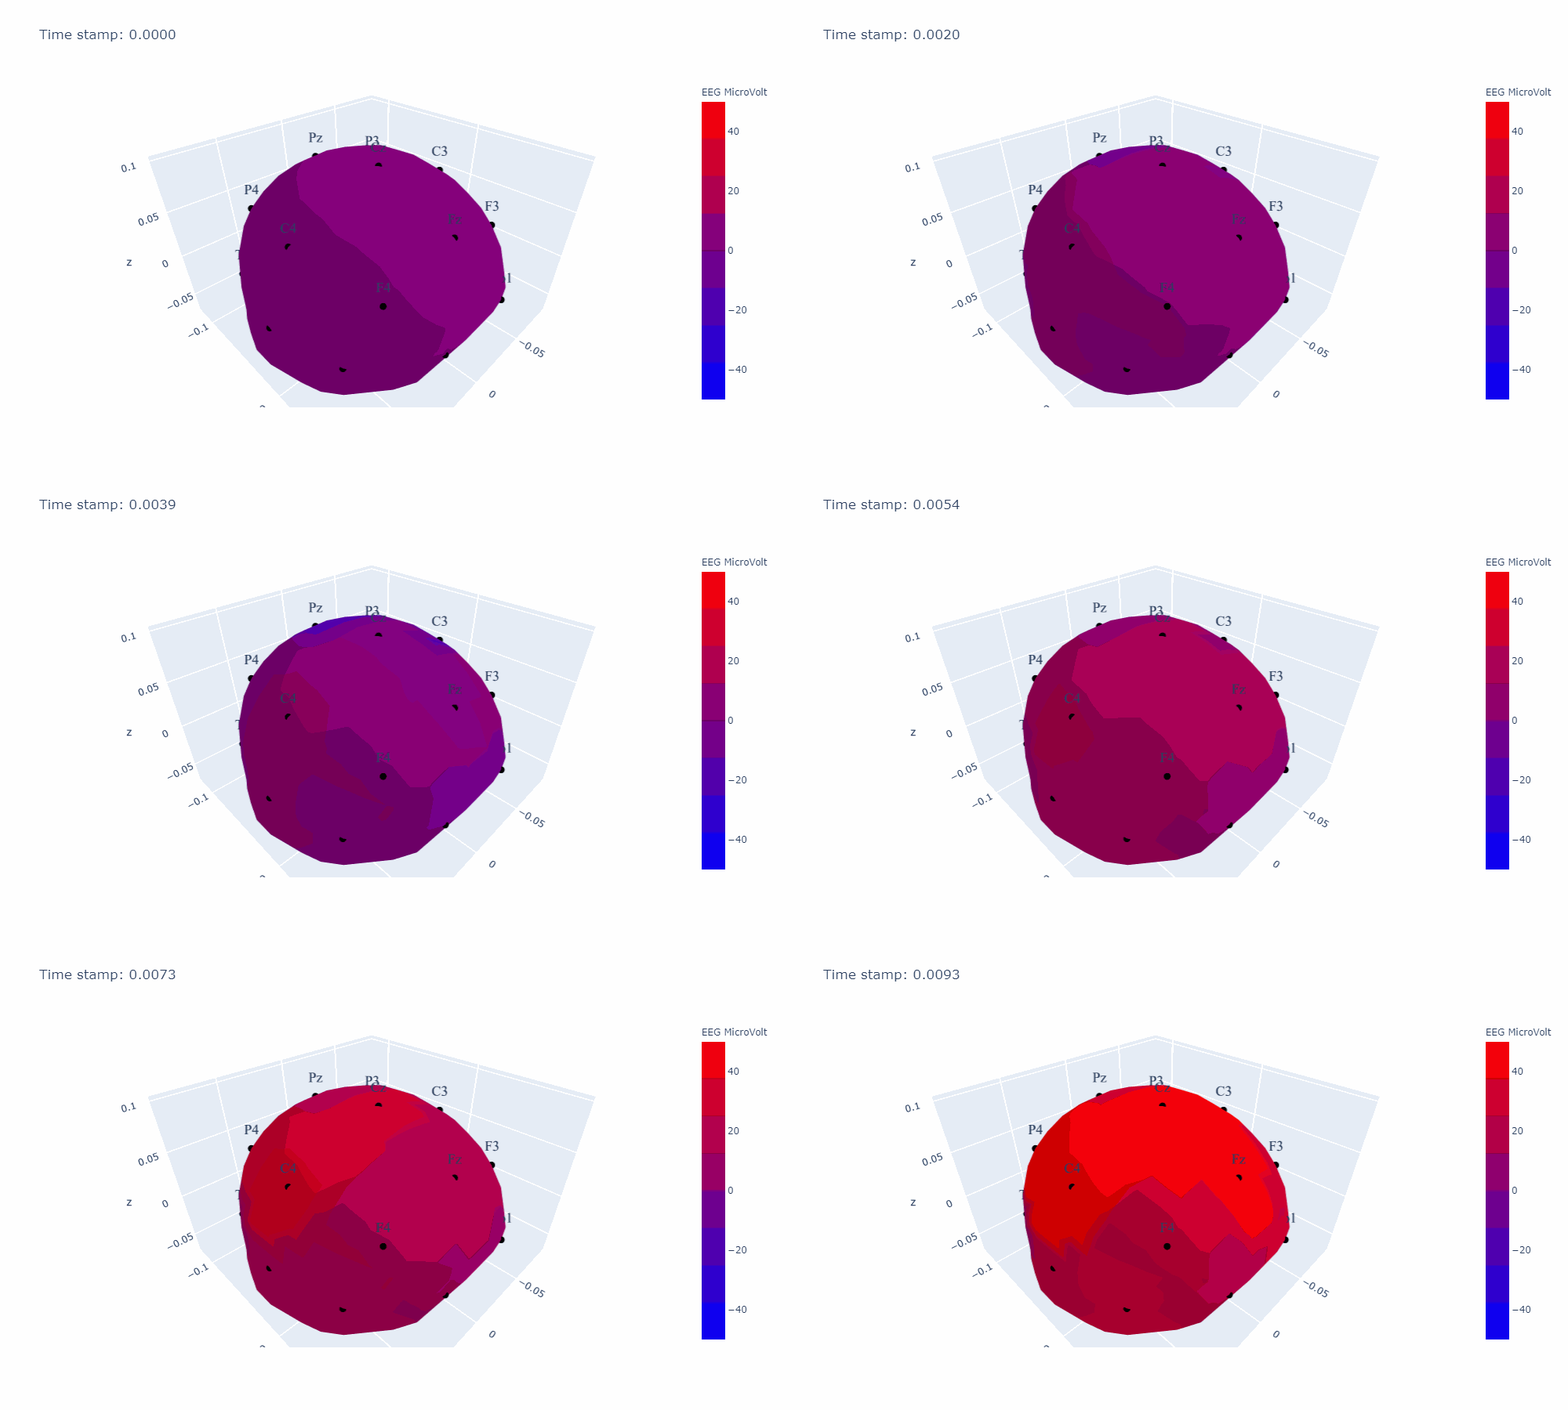
The 3D topographic head map provides a view of voltage measurements as a heatmap imposed on a 3D skull shape. It can be generated as an animation to view changes over time or as a standalone plot.

General Setup
Import required modules
from simpl_eeg import topomap_3d_head, eeg_objects
Create epoched data
For additional options see Creating EEG Objects section.
experiment_folder = "../../data/927"
nth_epoch = 0
epochs = eeg_objects.Epochs(experiment_folder)
epoch = epochs.get_epoch(nth_epoch)
Reading /Users/mpin/Documents/MDS/capstone/simpl_eeg_capstone/data/927/fixica.fdt
/Users/mpin/Documents/MDS/capstone/simpl_eeg_capstone/simpl_eeg/eeg_objects.py:199: RuntimeWarning: Data file name in EEG.data (927 fix ica correct.fdt) is incorrect, the file name must have changed on disk, using the correct file name (fixica.fdt).
raw = mne.io.read_raw_eeglab(data_path)
loaded raw from ../../data/927/fixica.set
Not setting metadata
Not setting metadata
33 matching events found
Setting baseline interval to [-0.2998046875, 0.0] sec
Applying baseline correction (mode: mean)
0 projection items activated
Loading data for 33 events and 2049 original time points ...
0 bad epochs dropped
Create a 3D topographic animation
Define parameters
A detailed description of all parameters can be found in the topomap_3d_head.animate_3d_head docstring:
help(topomap_3d_head.animate_3d_head)
Help on function animate_3d_head in module simpl_eeg.topomap_3d_head:
animate_3d_head(epoch, data_df=None, plot_title='', color_title='EEG MicroVolt', vmin=-50, vmax=50, colormap='Bluered')
df = None
vmin = -40
vmax = 40
colormap = "RdBu_r"
time_stamp = -300
Generating the animation
topo_3d_head = topomap_3d_head.animate_3d_head(
epoch,
data_df = df, # if you want to animate a data frame not values of epoch, you would still need to input the epoch for node locations
color_title="EEG MicroVolt",
vmin=vmin,
vmax=vmax,
colormap=colormap,
)
topo_3d_head.show()
