2D Head Visualizations
2D topographic head map
The 2D topographic head map provides a view of voltage measurements as a heatmap imposed on an image of a 2D skull. It can be generated as an animation to view changes over time or as a standalone plot.
General Setup
Import required modules
from simpl_eeg import topomap_2d, eeg_objects
Create epoched data
For additional options see Creating EEG Objects section.
experiment_folder = "../../data/109"
nth_epoch = 0
num_steps = 50  # number of steps to skip to shorten epoch

epochs = eeg_objects.Epochs(experiment_folder)
epoch = epochs.get_epoch(nth_epoch)
shortened_epoch = epochs.skip_n_steps(num_steps)
Reading /Users/mpin/Documents/MDS/capstone/simpl_eeg_capstone/data/109/fixica.fdt
/Users/mpin/Documents/MDS/capstone/simpl_eeg_capstone/simpl_eeg/eeg_objects.py:199: RuntimeWarning: Data file name in EEG.data (109 whole fixed ica.fdt) is incorrect, the file name must have changed on disk, using the correct file name (fixica.fdt).
  raw = mne.io.read_raw_eeglab(data_path)
loaded raw from ../../data/109/fixica.set
Not setting metadata
Not setting metadata
33 matching events found
Setting baseline interval to [-0.2998046875, 0.0] sec
Applying baseline correction (mode: mean)
0 projection items activated
Loading data for 33 events and 2049 original time points ...
0 bad epochs dropped
/Users/mpin/Documents/MDS/capstone/simpl_eeg_capstone/simpl_eeg/eeg_objects.py:823: RuntimeWarning: The measurement information indicates a low-pass frequency of 1024 Hz. The decim=50 parameter will result in a sampling frequency of 40.96 Hz, which can cause aliasing artifacts.
  return epochs.copy().decimate(num_steps)
Create a 2D topographic animation
Define parameters
A detailed description of all animation parameters can be found in the topomap_2d.animate_topomap_2d docstring:
help(topomap_2d.animate_topomap_2d)
Help on function animate_topomap_2d in module simpl_eeg.topomap_2d:

animate_topomap_2d(epoch, plotting_data=None, colormap='RdBu_r', mark='dot', vmin=-30, vmax=30, sphere='auto', colorbar=True, timestamp=True, frame_rate=12, **kwargs)
    Plots a still image mne.epochs.Epochs EEG data as a 2D topomap using the mne.viz.plot_topomap
    function.

    Parameters:
        epoch: mne.epochs.Epochs or mne.evoked.EvokedArray
            MNE epochs object (or evoked array object) containing portions of raw EEG data built
            around specified timestamp(s).
        plotting_data: numpy.ndarray or None
            Array of the EEG data from a measurement (not a time interval) to be plotted should be in
            the format (num_channels, num_frames) i.e. multiple rows of values for the timestamps you plan
            to plot. If plotting_data is provided the heatmap in the figure will be built from it in
            conjunction with the 'info' from the provided epoch (containing information like node names
            and locations). If no plotting_data is provided the heatmap will be built from the EEG data
            in the epoch instead.
        colormap: matplotlib colormap or None
            Specifies the 'colormap' parameter to be used in the mne.viz.plot_topomap() and
            in colorbar generation. Defaults to 'RdBu_r'.
        mark: str
            Specifies what kind of marker should be shown for each node on the topomap. Can be one of
            'dot', 'r+' (for red +'s), 'channel_name', or 'none'. Defaults to 'dot'.
        vmin: float
            Specifies the 'vmin' parameter in the mne.viz.plot_topomap() function.
            Sets the limits for the colors which will be used on the topomap. Value is
            in μV. Defaults to -30.
        vmax: float
            Specifies the 'vmax' parameter in the mne.viz.plot_topomap() function.
            Sets the limits for the colors which will be used on the topomap. Value is
            in μV. Defaults to +30.
        colorbar: bool
            Specifies whether or not to include a colorbar in the animation. Removing will lead to
            a marginal decrease in rendering times. Defaults to True.
        timestamp: bool
            Specifies whether or not to show the timestamp on the plot relative to the time in the epoch that
            is being shown. Defaults to True.
        frame_rate: int or float
            The frame rate to genearte the final animation with. Defaults to 12.
        **kwargs: various
            Additional arguments from the 'mne.viz.plot_topomap' function
            (https://mne.tools/stable/generated/mne.viz.plot_topomap.html) may also be passed. Since this function
            is used under-the-hood most of these arguments should work exactly as they do in their original
            function. The exact list of avalible arguments and their defaults includes: [contours: 0, sphere: 100,
            res: 64, extrapolate: 'head', outlines: 'head, mask: None, mask_params: None, image_interp: 'blinear',
            show: False, onselect: None, border: 'mean', ch_type: 'eeg']. The 'axes' argument is not avalible
            since it does not work with animations. Some arguments may break this function. The arguments that are
            tested and known to work include [res, sphere, extrapolate, outlines, contours, outlines, and border].

    Returns:
        ani: matplotlib.animation.FuncAnimation
            matplotlib funcanimation of a 2d topographic map based on the input epoch data.
# change values below to values of interest

# arguments built into the package
colormap = "Spectral"
mark = "dot"
vmin = -40
vmax = 40
colorbar = True
timestamp = True
frame_rate = 12

# some useful (and tested) arguments from the
# MNE.viz.plot_topomap function (see **kwargs) include...
contours = 0
res = 100
sphere = 100
extrapolate = "head"
outlines = "head"
border = "mean"
Generating the animation
%%capture

anim = topomap_2d.animate_topomap_2d(
    shortened_epoch, # REQUIRED
    colormap=colormap,
    mark=mark,
    vmin=vmin,
    vmax=vmax,
    colorbar=colorbar,
    timestamp=timestamp,
    frame_rate=frame_rate,
    contours=contours,
    res=res,
    sphere=sphere,
    extrapolate=extrapolate,
    outlines=outlines,
    border=border
)

from IPython.core.display import HTML

html_plot = anim.to_jshtml()
video = HTML(html_plot)
video
Saving the animation
Save as html
html_file_path = "examples/topo_2d.html"
html_file = open(html_file_path, "w")
html_file.write(html_plot)
html_file.close()
Save as gif
anim = topomap_2d.animate_topomap_2d(shortened_epoch)

gif_file_path = "examples/topo_2d.gif"
anim.save(gif_file_path, fps=5, dpi=300)
Save as mp4
anim = topomap_2d.animate_topomap_2d(shortened_epoch)

mp4_file_path = "examples/topo_2d.mp4"
anim.save(mp4_file_path)
Note
If FFMpegWriter does not work on your computer you can save the file as a gif first and then convert it into mp4 file by running the code below.
import moviepy.editor as mp

clip = mp.VideoFileClip(gif_file_path)
clip.write_videofile(mp4_file_path)
Create a 2D topographic plot
Define parameters
A detailed description of all animation parameters can be found in the topomap_2d.plot_topomap_2d docstring:
help(topomap_2d.plot_topomap_2d)
Help on function plot_topomap_2d in module simpl_eeg.topomap_2d:

plot_topomap_2d(epoch, plotting_data=None, recording_number=0, colormap='RdBu_r', colorbar=True, vmin=-30, vmax=30, mark='dot', sphere='auto', timestamp=True, **kwargs)
    Plots a still image mne.epochs.Epochs EEG data as a 2D topomap using the mne.viz.plot_topomap
    function.

    Parameters:
        epoch: mne.epochs.Epochs or mne.evoked.EvokedArray
            MNE epochs object (or evoked array object) containing portions of raw EEG data built
            around specified timestamp(s).
        plotting_data: numpy.ndarray or None
            Array of the EEG data from a measurement (not a time interval) to be plotted should be in
            the format (num_channels, ) i.e. a single row of values for the only timestamp you plan
            to plot. If plotting_data is provided the heatmap in the figure will be built from it in
            conjunction with the 'info' from the provided epoch (containing information like node
            names and locations). If no plotting_data is provided the heatmap will be built from the
            EEG data in the epoch instead. Defaults to None.
        recording_number: int
            The index of the data recording in the epoch to show in the plot. Defaults to 0.
        colormap: matplotlib colormap or None
            Specifies the 'colormap' parameter to be used in the mne.viz.plot_topomap() and
            in colorbar generation. Defaults to 'RdBu_r'.
        colorbar: bool
            Specifies whether to include a colorbar or not. Removing it will marginally improve
            performance. Defaults to True.
        vmin: float
            Specifies the 'vmin' parameter in the mne.viz.plot_topomap() function.
            Sets the limits for the colors which will be used on the topomap. Value is
            in μV. Defaults to -30.
        vmax: float
            Specifies the 'vmax' parameter in the mne.viz.plot_topomap() function.
            Sets the limits for the colors which will be used on the topomap. Value is
            in μV. Defaults to +30.
        mark: str
            Specifies what kind of marker should be shown for each node on the topomap. Can be one of
            'dot', 'r+' (for red +'s), 'channel_name', or 'none'. Deaults to 'dot'.
        timestamp: bool
            Specifies whether or not to show the timestamp on the plot relative to the time in the epoch that
            is being shown. Defaults to True.
        **kwargs: various
            Additional arguments from the 'mne.viz.plot_topomap' function
            (https://mne.tools/stable/generated/mne.viz.plot_topomap.html) may also be passed. Since this function
            is used under-the-hood most of these arguments should work exactly as they do in their original
            function. The exact list of avalible arguments and their defaults includes: [contours: 0, sphere: 100,
            res: 64, extrapolate: 'head', outlines: 'head, mask: None, mask_params: None, image_interp: 'blinear',
            show: False, onselect: None, border: 'mean', ch_type: 'eeg', axes: None]. Some arguments may break
            this function. The arguments that are tested and known to work include [res, sphere, extrapolate,
            outlines, contours, outlines, border].

    Returns:
        topo_2d_fig: matplotlib.image.AxesImage
            matplotlib image plot of a 2d topographic map based on the input epoch data.
timestamp=True
recording_number = 2
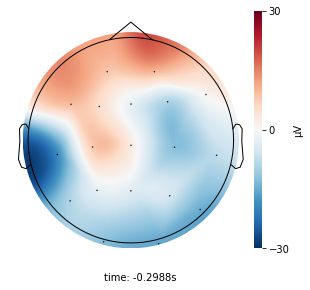
Generating a standalone plot
Note
Generating a plot will use the first data recording in the epoch by default.
plot = topomap_2d.plot_topomap_2d(
    epoch,
    timestamp=timestamp,
    recording_number=recording_number
)
plot;
Saving the plot
You can change the file to different formats by changing the format argument in the function. It supports png, pdf, svg.
file_path = "examples/topo_2d.svg"
plot.figure.savefig(file_path)