Binary Logistic Regression#
We will review the model you saw in DSCI 561 called Binary Logistic regression. From now on, we will use the term “binary” to differentiate it from further generalized linear models (GLMs) covered in this course. That said, it is essential to highlight that Binary Logistic regression is the most basic GLM.
Let us dig into this model by introducing an appropriate dataset.
Loading Libraries#
options(repr.plot.height = 9, repr.plot.width = 20, repr.matrix.max.rows = 6)
source("../scripts/support_functions.R")
library(tidyverse)
library(mlbench)
library(AER)
library(cowplot)
library(broom)
library(performance)
library(qqplotr)
1. The Breast Cancer Dataset#
The data frame breast_cancer is the Wisconsin Diagnostic Breast Cancer dataset (Mangasarian et al., 1995). It has a binary response target: whether the tumour is benign or malignant.
The Breast Cancer Dataset
This training dataset contains 569 observations from a digitized image of a fine needle aspirate (FNA) of a breast mass. The dataset details 30 real-valued characteristics (i.e., continuous regressors) plus the binary response and ID number. We will start working with the response target subject to the regressor mean_radius.
breast_cancer <- suppressWarnings(suppressMessages(read_csv("../datasets/breast_cancer.csv")))

breast_cancer_binary <- breast_cancer |>
  dplyr::select(mean_radius, target)
breast_cancer_binary
| mean_radius | target |
|---|---|
| <dbl> | <chr> |
| 17.99 | malignant |
| 20.57 | malignant |
| 19.69 | malignant |
| ⋮ | ⋮ |
| 16.60 | malignant |
| 20.60 | malignant |
| 7.76 | benign |
Main Statistical Inquiries
Let us suppose we want to assess the following:
Whether
targetandmean_radiusare statistically associated and by how much.Whether
targetandmean_textureare statistically associated and by how much.
2. Data Modelling Framework#
We will set our binary response \(Y_i\) mathematically as:
The “1” category is referred as success.
Note each \(Y_i\) is a Bernoulli trial whose probability of success is \(p_i\):
2.1. Using Ordinary Least-Squares to Model Probabilities#
We will take a “naive” approach to address our above main statistical inquiries. Suppose we use the “1” and “0” in the response as probabilities, and we estimate an Ordinary Least-squares (OLS) regression model to predict the mean of \(Y_i\) subject to mean_radius, \(X_{\texttt{mr}_i}\):
The code below transforms the response target, via mutate(), as a probability with two possible outcomes: 1 for malignant and 0 for benign.
breast_cancer_binary <- breast_cancer_binary |>
  mutate(target = if_else(target == "malignant", 1, 0))
breast_cancer_binary
| mean_radius | target |
|---|---|
| <dbl> | <dbl> |
| 17.99 | 1 |
| 20.57 | 1 |
| 19.69 | 1 |
| ⋮ | ⋮ |
| 16.60 | 1 |
| 20.60 | 1 |
| 7.76 | 0 |
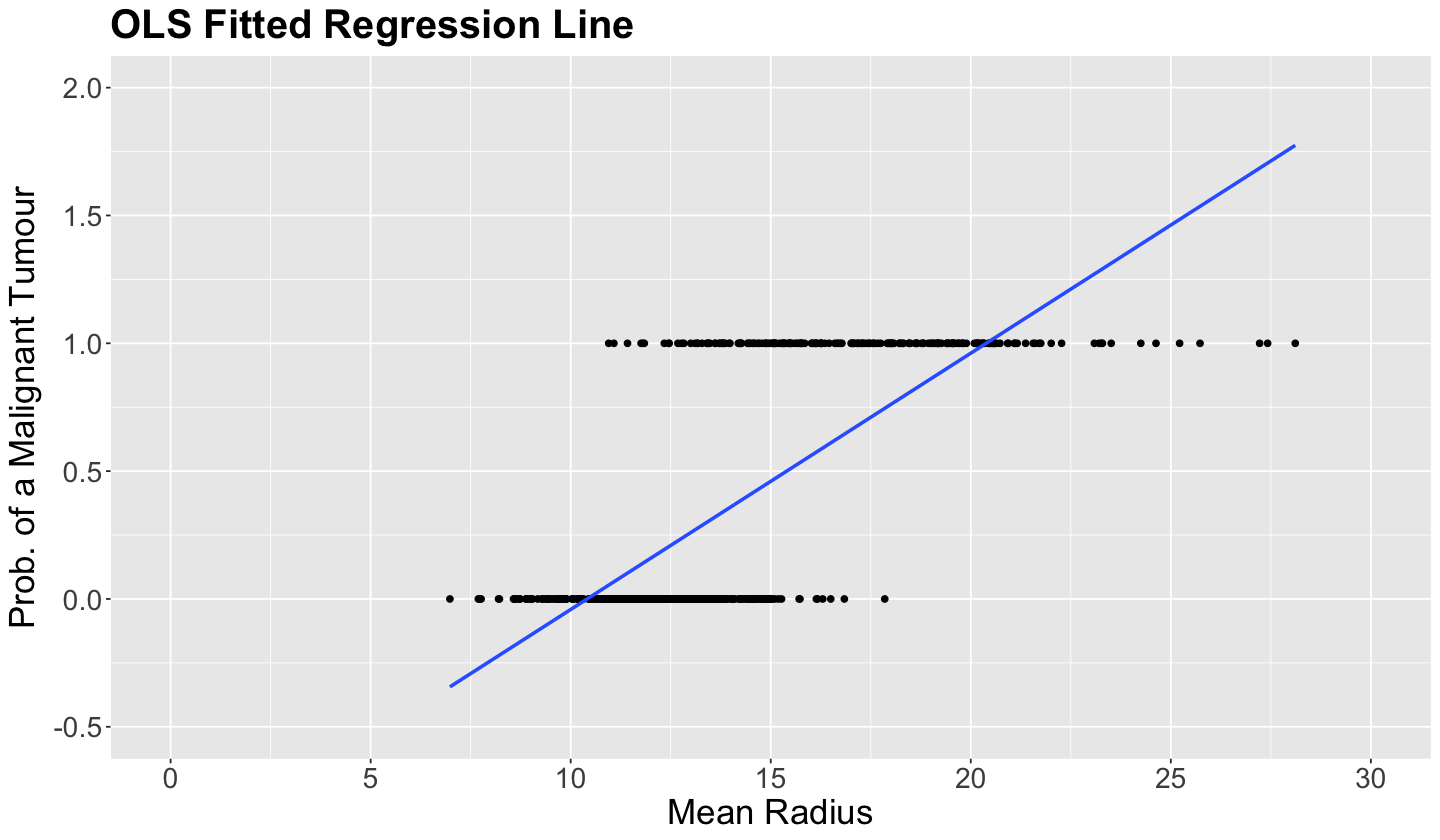
Thus, the plot below shows two subsets of points located on two horizontal lines. Note that those tumours classified as malignant (1 on the \(y\)-axis) tend to have a larger mean_radius.
Important
The OLS-fitted values of the 569 observations, with mean_radius as a regressor, are shown on the blue line. Recall that a probability cannot be negative or larger than \(1\). Nonetheless, values larger than \(20\) for mean_radius generate predictions larger than \(1\), which is absurd for a probability. Moreover, small values of mean_radius generate predictions of less than \(0\), which again does not make sense!
options(repr.plot.height = 7, repr.plot.width = 12)

breast_cancer_plot <- breast_cancer_binary |>
  ggplot() +
  geom_point(aes(mean_radius, target)) +
  geom_smooth(aes(mean_radius, target),
    method = "lm", formula = y ~ x, se = FALSE
  ) +
  labs(y = "Prob. of a Malignant Tumour", x = "Mean Radius") +
  ggtitle("OLS Fitted Regression Line") +
  theme(
    plot.title = element_text(size = 24, face = "bold"),
    axis.text = element_text(size = 17),
    axis.title = element_text(size = 21)
  ) +
  scale_x_continuous(breaks = seq(0, 30, 5), limits = c(0, 30)) +
  scale_y_continuous(breaks = seq(-0.5, 2, 0.5), limits = c(-0.5, 2))
breast_cancer_plot
2.2. The Logit Function#
Now, we might wonder:
Is there a way to overcome the above out-of-range issue?
Of course, there is a way involving a link function as explained in 4.9. Link Function. Nonetheless, a simple logarithmic transformation will not save the day here since we have \(Y_i\) values equal to zero. Therefore, let us play around with the distribution theory from DSCI 551. Recall these facts:
Given that the mean of a Bernoulli random variable \(Y_i\) is \(p_i\) under this modelling framework, we can establish the following link function (which is monotonic and differentiable):
Definition of the Logit Function
The link function (25) is called the logarithm of the odds or logit function. This logit function \(\log\left(\frac{p_i}{1 - p_i}\right)\) covers the entire real line, which solves the out-of-range problem from OLS in this case.
As a link function, the logit function is monotonic. Hence, how can we transform back \(h(p_i)\) to the probability \(p_i\)? With some algebraic arrangements, we can come up with the following expression:
Note that this whole modelling framework via this link function is called Binary Logistic regression.
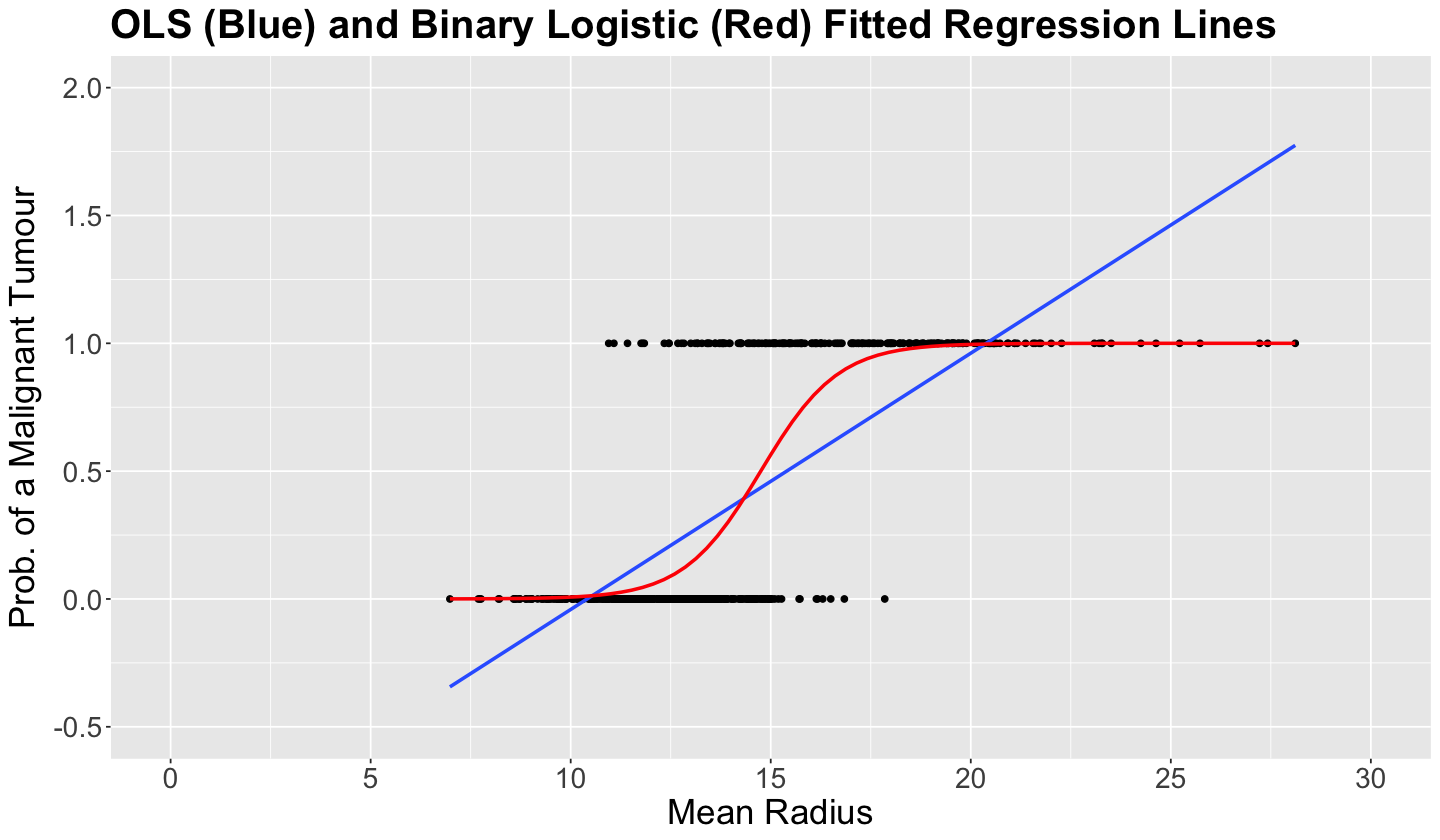
The plot below fits this simple (we only have one regressor!) Binary Logistic regression using breast_cancer_binary with target as a response and mean_radius as a regressor. We can do this via geom_smooth() using method = "glm" and method.args = c(family = binomial).
Then, we obtain the in-sample predictions
and connect them as a red line. This red \(S\)-shaped function above is called the sigmoid function. Note this function covers all the real line of mean_radius but it is constrained between 0 and 1 for the probability of encountering a malignant tumour.
2.3. General Modelling Framework#
The Binary Logistic regression model has a response variable in the form:
As the response variable can only take the values \(0\) or \(1\), the key parameter becomes the probability that \(Y_i\) takes on the value of \(1\), i.e. the probability of success, denoted as \(p_i\). Hence:
The Binary Logistic regression approach models the probability of success, \(p_i\), of the binary response \(Y_i\). To re-express \(p_i\) on an unrestricted scale, the modelling is done in terms of the logit function (the link function in this model).
Specifically, for a training set of size \(n\), \(p_i\) (\(i = 1, 2, \dots, n\)) will depend on the values of the \(k\) regressors \(X_{i, 1}, X_{i, 2}, \dots, X_{i, k}\) in the form:
or equivalently
Note that the \(\log(\cdot)\) notation in the model above refers to the natural logarithm, i.e., logarithm base \(e\). The equation above for \(p_i\) shows that this Binary Logistic regression model will result in values of the probability of success \(p_i\) that are always between 0 and 1.
Important
The response in this GLM is called the log-odds, the logarithm of the odds
the ratio of the probability of the event to the probability of the non-event. For instance, if the event is that the tumour is malignant, the odds denote how likely the \(i\)th tumour is to be malignant compared to how unlikely it is. The coefficient \(\beta_j\) (\(j = 1, \dots, k\)) in (26) denotes how much the log-odds increases or decreases when a given continuous regressor changes by one unit.
3. Estimation#
Under a general framework with \(k\) regressors, the regression parameters \(\beta_0, \beta_1, \dots, \beta_k\) in this model are also unknown. In order to fit the model, we can use the function glm() and its argument family = binomial (required to specify the binary nature of the response), which obtains the estimates \(\hat{\beta}_0, \hat{\beta}_1, \dots, \hat{\beta}_k\) (note the hat notation).
The estimates are obtained through maximum likelihood where we assume a joint probability mass function of the \(n\) responses \(Y_i\).
Important
For the sake of coding clarity, you could also use family = binomial(link = "logit"). Nevertheless, link = "logit" is a default in glm() for Binary Logistic regression. Thus, family = binomial suffices when using the logit function.
binary_log_model <- glm(as.factor(target) ~ mean_radius,
  data = breast_cancer_binary, family = binomial
)
4. Inference#
We can determine whether a regressor is statistically associated with the logarithm of the response’s odds through hypothesis testing for the parameters \(\beta_j\). We will need information about the estimated regression coefficient \(\hat{\beta}_j\) and its corresponding variability which is reflected in the standard error of the estimate, \(\mbox{se} \left( \hat{\beta}_j \right)\).
To determine the statistical significance of \(\hat{\beta}_j\), you can use the Wald statistic
to test the hypotheses
A statistic like \(z_j\) is analogous to the \(t\)-value in OLS regression. However, in Binary Logistic regression, provided the sample size \(n\) is large enough, \(z_j\) has an approximately Standard Normal distribution under \(H_0\) rather than a \(t\)-distribution.
R provides the corresponding \(p\)-value for each \(\beta_j\). The smaller the \(p\)-value, the stronger the evidence against the null hypothesis \(H_0\). Hence, a small enough \(p\)-value (less than the significance level \(\alpha\)) indicates that the data provides evidence in favour of association (or causation in the case of an experimental study!) between the log-dds and the \(j\)th regressor. Furthermore, given a specified level of confidence, we can construct approximate \((1 - \alpha) \times 100\%\) confidence intervals (CIs) for the corresponding true value of \(\beta_j\):
where \(z_{\alpha/2}\) is the upper \(\alpha/2\) quantile of the Standard Normal distribution.
Now, we can answer the following:
Is
mean_radiusstatistically associated with the logarithm of the odds oftarget?
We can also use the function tidy() from the broom package along with argument conf.int = TRUE to get the 95% confidence intervals by default.
tidy(binary_log_model, conf.int = TRUE) |>
  mutate_if(is.numeric, round, 3)
| term | estimate | std.error | statistic | p.value | conf.low | conf.high |
|---|---|---|---|---|---|---|
| <chr> | <dbl> | <dbl> | <dbl> | <dbl> | <dbl> | <dbl> |
| (Intercept) | -15.246 | 1.325 | -11.510 | 0 | -18.034 | -12.826 |
| mean_radius | 1.034 | 0.093 | 11.101 | 0 | 0.864 | 1.230 |
Our sample gives us evidence to reject \(H_0\) (\(p\text{-value} < .001\)). So mean_radius is statistically associated to the logarithm of the odds of target.
5. Coefficient Interpretation#
What is the interpretation of the estimate \(\hat{\beta}_1\) for
mean_radiuson the responsetarget?
We have to transform back our estimated coefficient \(\hat{\beta_1}\) to the original scale of the odds \(\frac{p_i}{1 - p_i}\). Function tidy() has the handy argument exponentiate = TRUE which exponentiates the estimate column along with the CIs (note the rest of the columns remain untransformed).
tidy(binary_log_model, conf.int = TRUE, exponentiate = TRUE) |>
  mutate_if(is.numeric, round, 3)
| term | estimate | std.error | statistic | p.value | conf.low | conf.high |
|---|---|---|---|---|---|---|
| <chr> | <dbl> | <dbl> | <dbl> | <dbl> | <dbl> | <dbl> |
| (Intercept) | 0.000 | 1.325 | -11.510 | 0 | 0.000 | 0.00 |
| mean_radius | 2.811 | 0.093 | 11.101 | 0 | 2.372 | 3.42 |
The interpretation is:
For each unit increase in
mean_radius, the tumour is 2.811 times more likely to be malignant than to be benign.
This example does not provide interpretations for categorical explanatory variables. That said, as in OLS multiple regression, the model would estimate multiple regression coefficients for that categorical explanatory variable: one for each level other than the baseline level. The interpretation of each estimated regression coefficient will depend on which category is specified as the baseline category.
Recall Table 1, which describes dummy variables for a nominal explanatory variable with \(u\) categories, where Level 1 was specified as the baseline level, so all \(u - 1\) dummy variables are zero for that level. The estimated regression coefficient for Level 2 represents how much the log-odds increases or decreases compared to the baseline category. The same interpretation applies to the regression coefficients for levels \(3, \dots, u\). If we want to interpret these coefficients on the original scale of the odds \(\frac{p_i}{1 - p_i}\), then we exponentiate each one of these estimated coefficients.
Now, let us fit a second model with two regressors: mean_radius (\(X_{\texttt{mr}_i}\)) and mean_texture (\(X_{\texttt{mt}_i}\)) for the \(i\)th observation:
Firstly, we select the necessary columns from our dataset breast_cancer.
breast_cancer_binary_2 <- breast_cancer |>
  dplyr::select(mean_radius, mean_texture, target)
breast_cancer_binary_2
| mean_radius | mean_texture | target |
|---|---|---|
| <dbl> | <dbl> | <chr> |
| 17.99 | 10.38 | malignant |
| 20.57 | 17.77 | malignant |
| 19.69 | 21.25 | malignant |
| ⋮ | ⋮ | ⋮ |
| 16.60 | 28.08 | malignant |
| 20.60 | 29.33 | malignant |
| 7.76 | 24.54 | benign |
Then, we fit the corresponding Binary Logistic regression.
binary_log_model_2 <- glm(as.factor(target) ~ mean_radius + mean_texture,
  data = breast_cancer_binary_2, family = binomial)
tidy(binary_log_model_2, conf.int = TRUE) |>
  mutate_if(is.numeric, round, 3)
| term | estimate | std.error | statistic | p.value | conf.low | conf.high |
|---|---|---|---|---|---|---|
| <chr> | <dbl> | <dbl> | <dbl> | <dbl> | <dbl> | <dbl> |
| (Intercept) | -19.849 | 1.774 | -11.189 | 0 | -23.592 | -16.615 |
| mean_radius | 1.057 | 0.101 | 10.417 | 0 | 0.872 | 1.271 |
| mean_texture | 0.218 | 0.037 | 5.885 | 0 | 0.147 | 0.293 |
Note that both regressors (mean_radius and mean_texture) are statistically significant for the response target (\(p\text{-values} < .001\)). Then, we make the corresponding coefficient interpretations:
tidy(binary_log_model_2, conf.int = TRUE, exponentiate = TRUE) |>
  mutate_if(is.numeric, round, 3)
| term | estimate | std.error | statistic | p.value | conf.low | conf.high |
|---|---|---|---|---|---|---|
| <chr> | <dbl> | <dbl> | <dbl> | <dbl> | <dbl> | <dbl> |
| (Intercept) | 0.000 | 1.774 | -11.189 | 0 | 0.000 | 0.000 |
| mean_radius | 2.878 | 0.101 | 10.417 | 0 | 2.393 | 3.566 |
| mean_texture | 1.244 | 0.037 | 5.885 | 0 | 1.159 | 1.341 |
The interpretation for mean_radius is:
For each unit increase in
mean_radius, the tumour is 2.878 times more likely to be malignant than to be benign while holdingmean_textureconstant.
The interpretation for mean_texture is:
For each unit increase in
mean_texture, the tumour is 1.244 times more likely to be malignant than to be benign while holdingmean_radiusconstant.
Important
Note that the estimated coefficients for each regressor are standalone. Hence, we have to clarify that each estimate stands while holding the other regressor constant. This same interpretation holds with more than two regressors.
7. Predictions#
Suppose we want to predict the odds of a tumour being malignant to being benign using our trained binary_log_model_2. This tumour has the following values for mean_radius and mean_texture: \(x_{\texttt{mr}} = 16\) and \( x_{\texttt{mt}} = 20\), respectively.
We use binary_log_model_2 for making such prediction as follows:
We can use the function predict() via the argument type = "link" to obtain the predicted logarithm of the odds. Then, we exponentiate it to get the predicted odds.
round(exp(predict(binary_log_model_2,
  tibble(mean_radius = 16, mean_texture = 20),
  type = "link")), 2)
Hence, a tumour with \(x_{\texttt{mr}} = 16\) and \( x_{\texttt{mt}} = 20\) is predicted to be 4.17 times more likely to be malignant than benign.
Can We Predict Probabilities For Classification Purposes?
Using the function predict() via the argument type = "response" with the object binary_log_model_2, we can obtain the estimated probability for a tumour to be malignant with the following values for mean_radius and mean_texture: \(x_{\texttt{mr}} = 16\) and \( x_{\texttt{mt}} = 20\), respectively.
round(predict(binary_log_model_2,
  tibble(mean_radius = 16, mean_texture = 20),
  type = "response"
), 2)
Hence, a tumour with \(x_{\texttt{mr}} = 16\) and \( x_{\texttt{mt}} = 20\) has a predicted probability of 0.81 of beign malignant.
8. Model Selection#
To perform model selection, let us recall our two Binary Logistic regression models with target as a response. Model 1 will only have the continuous mean_radius (\(X_{\texttt{mr}_i}\)) as a regressor (i.e., binary_log_model), whereas Model 2 will have mean_radius and mean_texture (\(X_{\texttt{mr}_i}\) and \(X_{\texttt{mt}_i}\)) as regressors (i.e, binary_log_model_2).
Since we are digging into model selection, we want to determine which Binary Logistic regression model fits the data better: Model 1 or Model 2. Let us explore some selection techniques.
8.1. Analysis of Deviance#
The deviance (\(D_k\)) criterion can be used to compare a given model with \(k\) regressors with that of a baseline model. The usual baseline model is the saturated or full model, which perfectly fits the data because it allows a distinct probability of success \(p_i\) for the \(i\)th observation in the training dataset (\(i = 1, \dots, n\)), unrelated to the \(k\) regressors.
Important
Given the definition of the saturated or full model under this context, we can view it as an overfitted model. Thus, we aim to avoid this type of model!
The maximized likelihood of this full model is denoted as \(\hat{\mathscr{l}}_f\). Now, let \(\hat{\mathscr{l}}_k\) be the value of the maximized likelihood computed from our dataset of \(n\) observation with \(k\) regressors.
We can compare the fits provided by these two models by the deviance \(D_k\) given by
Note that \(D_k\) expresses how much our given model deviates from the full model on log-likelihood scale. This metric is interpreted as follows:
Large values of \(D_k\) arise when \(\hat{\mathscr{l}}_k\) is small relative to \(\hat{\mathscr{l}}_f\), indicating that our given model fits the data poorly compared to the baseline model.
Small values of \(D_k\) arise when \(\hat{\mathscr{l}}_k\) is similar to \(\hat{\mathscr{l}}_f\), indicating that our given model provides a good fit to the data compared to the baseline model.
For the specific case of the Binary Logistic regression, it can be shown that \(D_k\) (27) is represented by the following equation:
where \(\hat{p}_i\) is the estimated probability of success for the \(i\)th observation for \(i = 1, \dots, n\) in our training set with our fitted model of \(k\) regressors. Equation (28) above comes from maximum likelihood estimation (MLE).
Note
The mathematical proof for Equation (28) can be checked in Collett (2003) in Chapter 3 (Section 3.8.2).
Important
For the specific case of Binary Logistic regression, deviance \(D_k\) (28) cannot be used as a standalone metric of goodness of fit because of data sparsity; i.e., each \(i\)th observation has a different set of observed values for the \(k\) regressors if at least one of them is of continuous-type.
This data sparsity puts \(D_k\) just in function of the fitted probabilities \(\hat{p}_i\) and not on the observed values \(y_i\) (which tells us nothing about the agreement of our model with \(k\) regressors to the observed data!).
Still, for the case of Binary Logistic regression, we can use the analysis of deviance to perform model selection between two models where one is nested in the other (as in this example for Model 1 and Model 2). So we will use our two models: binary_log_model (Model 1) with mean_radius as a regressor, which is nested in binary_log_model_2 (Model 2) with mean_radius and mean_texture as regressors.
This specific model selection will involve a hypothesis testing. The hypotheses are:
We have to use the multipurpose function anova() in the following way:
round(anova(binary_log_model,
  binary_log_model_2,
  test = "Chi"
), 4)
| Resid. Df | Resid. Dev | Df | Deviance | Pr(>Chi) | |
|---|---|---|---|---|---|
| <dbl> | <dbl> | <dbl> | <dbl> | <dbl> | |
| 1 | 567 | 330.0108 | NA | NA | NA |
| 2 | 566 | 291.1233 | 1 | 38.8875 | 0 |
Let \(D_2\) be the deviance (column Resid. Dev) for Model 2 (binary_log_model_2) in row 2 and \(D_1\) (column Resid. Dev) the deviance for Model 1 (binary_log_model) in row 1. The test statistic \(\Delta_D\) (column Deviance) for the analysis of deviance is given by:
which assymptotically (i.e., \(n \rightarrow \infty\)) is Chi-squared distributed with \(1\) degree of freedom (column Df) under \(H_0\) for this specific case.
We obtain a \(p\text{-value} < .001\), column Pr(>Chi), which gives us evidence to reject \(H_0\). Hence, we have evidence to conclude that binary_log_model_2 fits the data better than binary_log_model. Therefore, in the context of model selection, adding mean_texture provides a better fitted model. Hence, we would choose binary_log_model_2.
Important
In general, the degrees of freedom are the regression parameters of difference between both models, which is \(1\) in this example given that Model 2 has an additional parameter \(\beta_2\).
Formally, this nested hypothesis testing is called the likelihood-ratio test.
8.2. Akaike Information Criterion#
One of the drawbacks of the analysis of deviance is that it only allows to test nested regression models when we have sparse data (i.e., each response is associated with a different set of values in the regressors).
Fortunately, we have alternatives for model selection. The Akaike Information Criterion (AIC) makes it possible to compare models that are either nested or not. For a model with \(k\) regressors and a deviance \(D_k\) is defined as:
Models with smaller values of \(\mbox{AIC}_k\) are preferred. That said, \(\mbox{AIC}_k\) favours models with small values of \(D_k\).
Important
However, \(\mbox{AIC}_k\) penalizes for including more regressors in the model. Hence, it discourages overfitting, which is key in model selection.
This is why we select that model with the smallest \(\mbox{AIC}_k\).
The function glance() shows us the \(\mbox{AIC}_k\) by model.
glance(binary_log_model) |>
  mutate_if(is.numeric, round, 3)
| null.deviance | df.null | logLik | AIC | BIC | deviance | df.residual | nobs |
|---|---|---|---|---|---|---|---|
| <dbl> | <dbl> | <dbl> | <dbl> | <dbl> | <dbl> | <dbl> | <dbl> |
| 751.44 | 568 | -165.005 | 334.011 | 342.699 | 330.011 | 567 | 569 |
glance(binary_log_model_2) |>
  mutate_if(is.numeric, round, 3)
| null.deviance | df.null | logLik | AIC | BIC | deviance | df.residual | nobs |
|---|---|---|---|---|---|---|---|
| <dbl> | <dbl> | <dbl> | <dbl> | <dbl> | <dbl> | <dbl> | <dbl> |
| 751.44 | 568 | -145.562 | 297.123 | 310.155 | 291.123 | 566 | 569 |
Following the results of the above
AICcolumns, we choosebinary_log_model_2overbinary_log_model.
8.3. Bayesian Information Criterion#
An alternative to AIC is the Bayesian Information Criterion (BIC). The BIC also makes it possible to compare models that are either nested or not. For a model with \(k\) regressors, \(n\) observations used for training, and a deviance \(D_k\); it is defined as:
Models with smaller values of \(\mbox{BIC}_k\) are preferred. That said, \(\mbox{BIC}_k\) also favours models with small values of \(D_k\).
Important
The differences between AIC and BIC will be more pronounced in datasets with large sample sizes \(n\). As the BIC penalty of \(k \log (n)\) will always be larger than the AIC penalty of \(2k\) when \(n > 7\), BIC tends to select models with fewer regressors than AIC.
Following the results of the
BICcolumn above, we also choosebinary_log_model_2overbinary_log_model(columnBIC).
(Optional) 9. Model Diagnostics#
Model diagnostics in GLMs are not the same ones from OLS regression and there is still an open research field for them. We will check two different plots for the Binary Logistic regression model.
9.1. Deviance Residuals#
We can obtain more than one class of residual in a Binary Logistic regression. However, we will concentrate on the deviance residuals. A deviance residual for the \(i\)th binary observation \(y_i\) is defined as:
where \(\hat{p}_i\) is the predicted probability of success coming from the model.
The sum all the \(n\) \(d_i\)s in the model is the deviance \(D_k\) (column deviance below via function glance() by model).
glance(binary_log_model) |>
  mutate_if(is.numeric, round, 3)
| null.deviance | df.null | logLik | AIC | BIC | deviance | df.residual | nobs |
|---|---|---|---|---|---|---|---|
| <dbl> | <dbl> | <dbl> | <dbl> | <dbl> | <dbl> | <dbl> | <dbl> |
| 751.44 | 568 | -165.005 | 334.011 | 342.699 | 330.011 | 567 | 569 |
glance(binary_log_model_2) |>
  mutate_if(is.numeric, round, 3)
| null.deviance | df.null | logLik | AIC | BIC | deviance | df.residual | nobs |
|---|---|---|---|---|---|---|---|
| <dbl> | <dbl> | <dbl> | <dbl> | <dbl> | <dbl> | <dbl> | <dbl> |
| 751.44 | 568 | -145.562 | 297.123 | 310.155 | 291.123 | 566 | 569 |
With a large enough sample size \(n\), the deviance residuals are approximately normally distributed. Hence, we could use \(Q\)-\(Q\) plots for both models. To deliver these \(Q\)-\(Q\) plots, we need to extract the deviance residuals from the Binary Logistic regression models. We can do it via the function residuals() with the argument type = "deviance". Below you can find the code to extract these residuals from binary_log_model and binary_log_model_2.
binary_log_model_dev_residuals <- data.frame(dev_residuals = residuals(binary_log_model,
  type = "deviance"
))
binary_log_model_dev_residuals
| dev_residuals | |
|---|---|
| <dbl> | |
| 1 | 0.26282111 |
| 2 | 0.06983906 |
| 3 | 0.10995490 |
| ⋮ | ⋮ |
| 567 | 0.52511283 |
| 568 | 0.06876592 |
| 569 | -0.03815040 |
binary_log_model_2_dev_residuals <- data.frame(dev_residuals = residuals(binary_log_model_2,
  type = "deviance"
))
binary_log_model_2_dev_residuals
| dev_residuals | |
|---|---|
| <dbl> | |
| 1 | 0.65442997 |
| 2 | 0.07886868 |
| 3 | 0.08590128 |
| ⋮ | ⋮ |
| 567 | 0.20788406 |
| 568 | 0.02201645 |
| 569 | -0.06078262 |
We can code these plots “by hand” using ggplot2(), but we will save up time using package qqplotr. The file support_functions.R in the repo’s folder scripts contains the function qqplot_dev_residuals(), which uses qqplotr’s tools. This function shows the \(Q\)-\(Q\) plot for the deviance residuals of each fitted model. It needs these residuals in the data argument and a proper title.
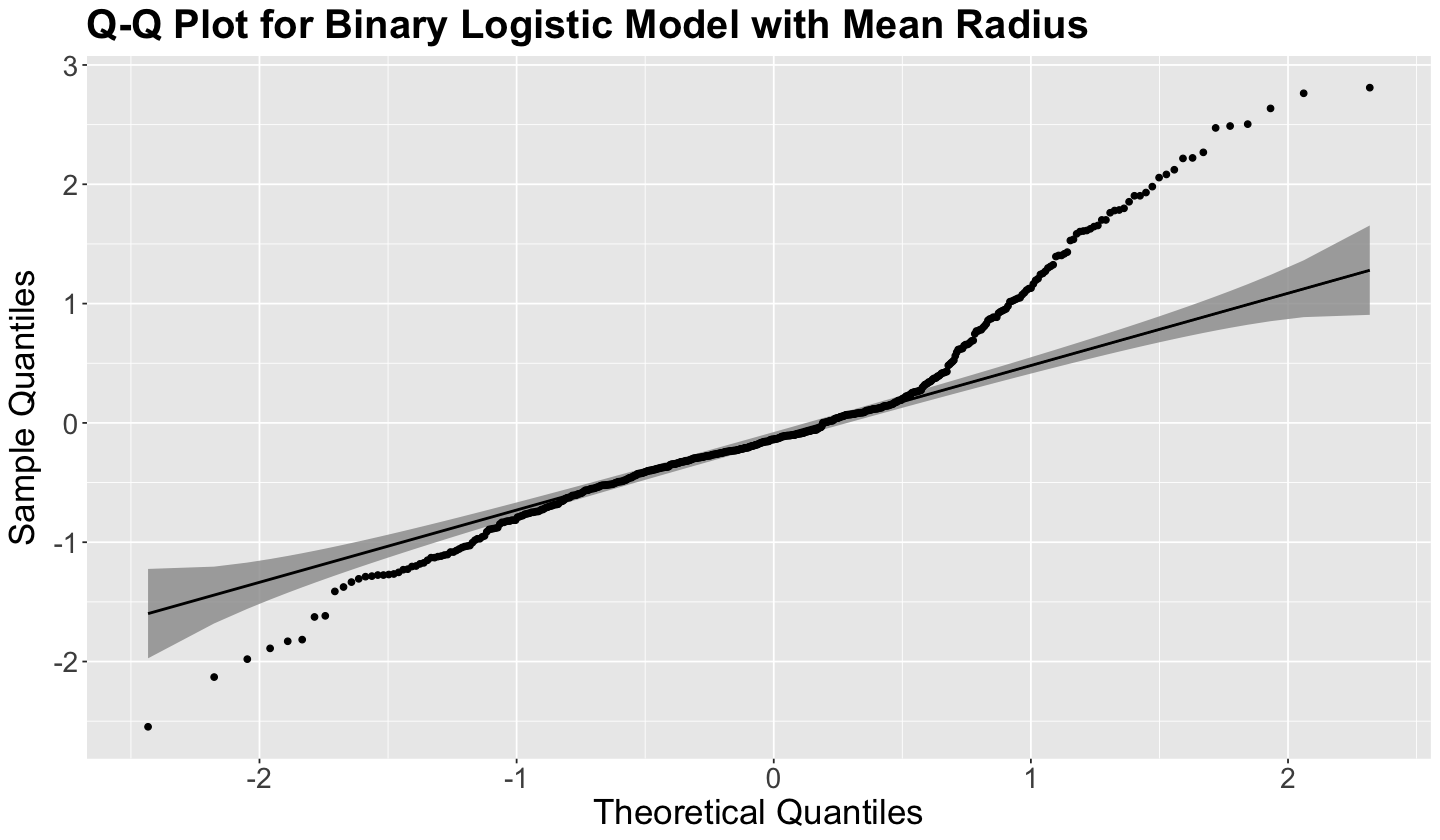
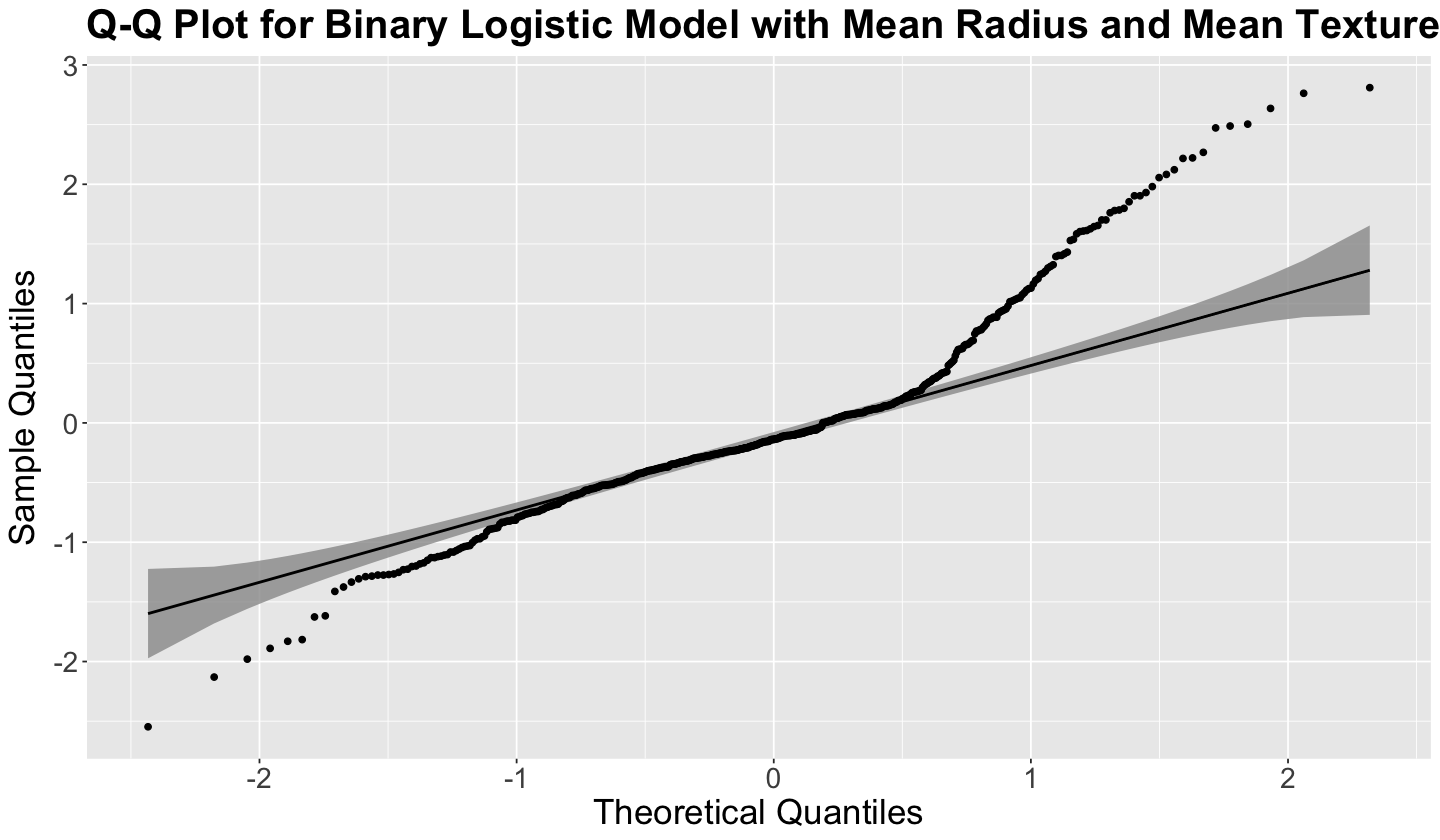
The advantage of qqplotr is that, besides the usual 45° degree line, it allows us to plot 95% (by default) confidence bands. Since we cannot expect all points to be on the 45° degree line, we still expect them to be within the confidence bands. Nonetheless, we have serious non-normality issues on both models for the most extreme observations, as shown below.
qqplot_dev_residuals(
  data = binary_log_model_dev_residuals,
  title = "Q-Q Plot for Binary Logistic Model with Mean Radius"
)
9.2. Binned Residual Plots#
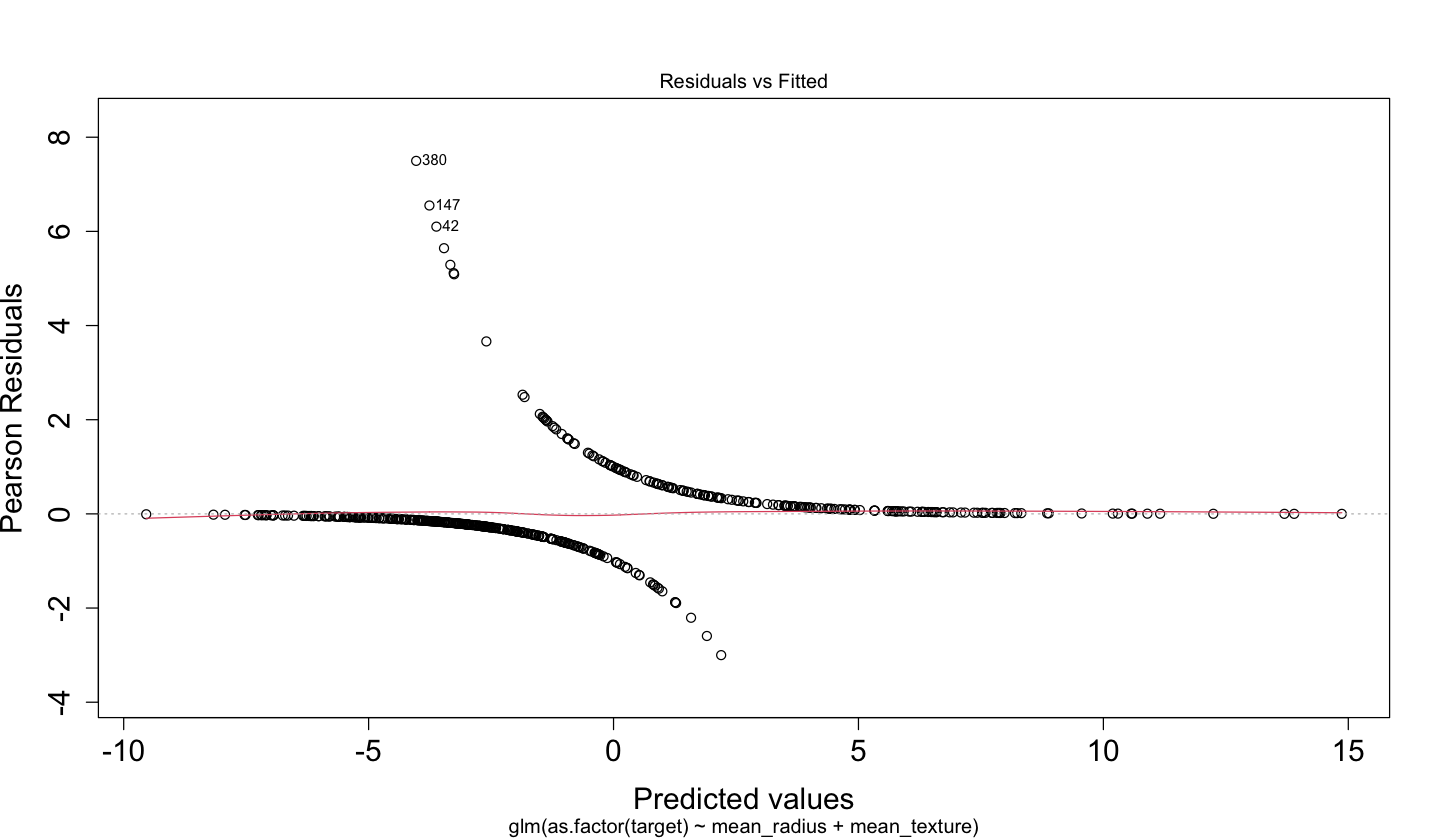
A plot of the deviance residuals \(d_i\) versus fitted values \(\mbox{logit}(p_i)\) (as the one below for binary_log_model_2) might not be too informative. This class of diagnostic plot makes sense for OLS to verify we are fulfilling the constant variance assumption on the random component. Nevertheless, it is not the case for Binary Logistic regression since each response is an independent Bernoulli trial with its parameter \(p_i\).
Besides deviance residuals, the Binary Logistic regression model has the \(i\)th raw residual \(r_i\) as the difference between the binary observed \(y_i\) and the fitted value \(\hat{p}_i\):
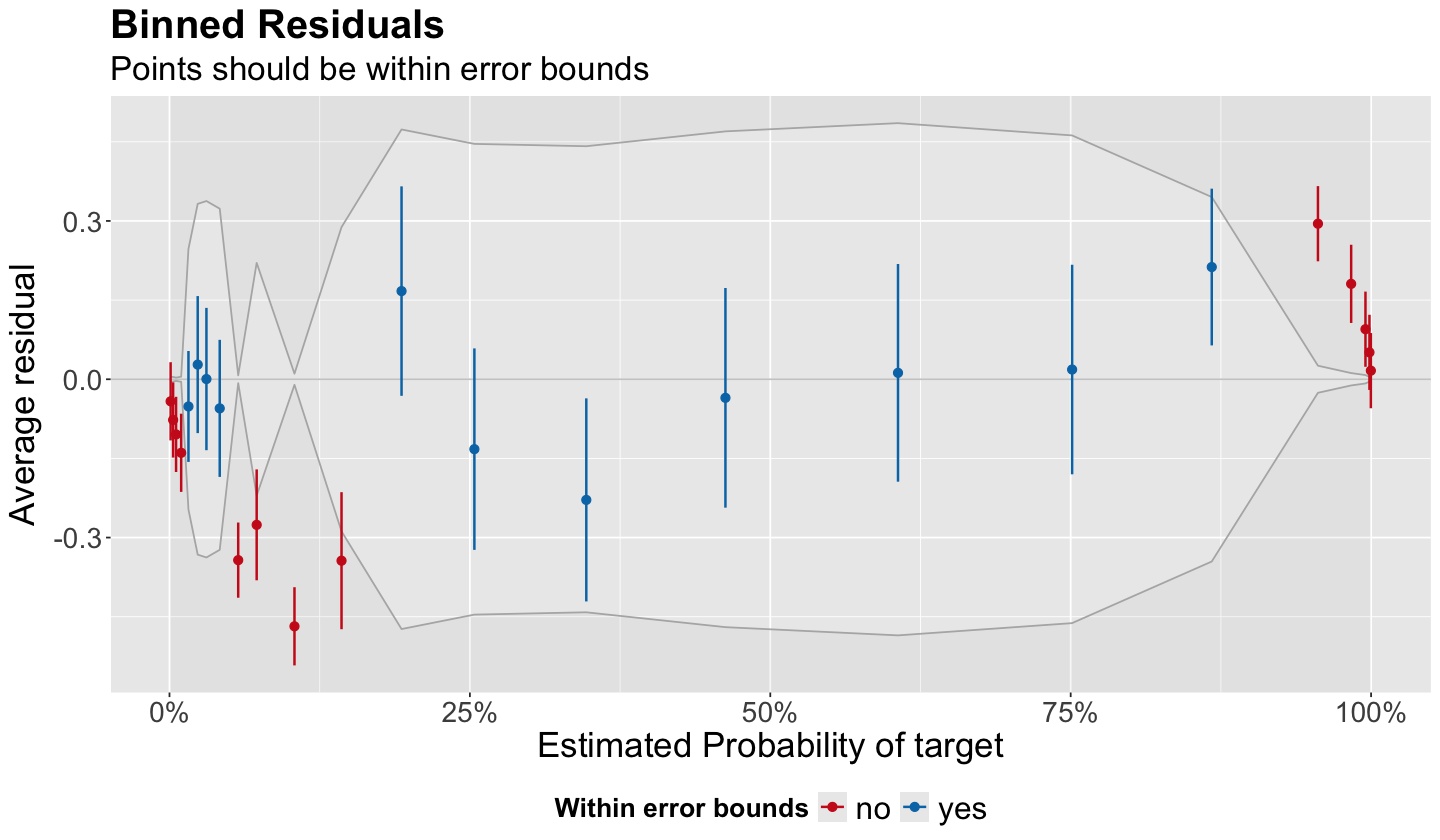
Gelman and Hill (2007) recommend using binned residual plots. These plots are available via the package performance and its function binned_residuals(). Its argument is the fitted model as in the code below. The output is a data frame used to build the corresponding diagnostic plot.
diagnostic_bins <- binned_residuals(binary_log_model_2)
diagnostic_bins
| xbar | ybar | n | x.lo | x.hi | se | CI_low | CI_high | group | |
|---|---|---|---|---|---|---|---|---|---|
| <dbl> | <dbl> | <int> | <dbl> | <dbl> | <dbl> | <dbl> | <dbl> | <chr> | |
| conf_int | 0.0009379625 | -0.04178677 | 23 | 7.190053e-05 | 0.001845559 | 0.004780543 | -0.1158793 | 0.032305796 | no |
| conf_int1 | 0.0030236387 | -0.07712111 | 24 | 1.897157e-03 | 0.004319643 | 0.004275154 | -0.1483579 | -0.005884315 | no |
| conf_int2 | 0.0054739696 | -0.10450147 | 24 | 4.374413e-03 | 0.007189815 | 0.003115474 | -0.1757383 | -0.033264675 | no |
| ⋮ | ⋮ | ⋮ | ⋮ | ⋮ | ⋮ | ⋮ | ⋮ | ⋮ | ⋮ |
| conf_int21 | 0.9953239 | 0.09486664 | 24 | 0.9918863 | 0.9973316 | 0.007948755 | 0.02362984 | 0.1661034 | no |
| conf_int22 | 0.9986466 | 0.05095846 | 24 | 0.9976117 | 0.9994714 | 0.004327612 | -0.02027833 | 0.1221953 | no |
| conf_int23 | 0.9998101 | 0.01630470 | 24 | 0.9994960 | 0.9999997 | 0.004362187 | -0.05493210 | 0.0875415 | no |
Then, we can obtain the binned residual plot via the function plot(). The resulting plot is a ggplot object.
plot(diagnostic_bins) +
  theme(
    plot.title = element_text(size = 24, face = "bold"),
    plot.subtitle = element_text(size = 20),
    axis.text = element_text(size = 17),
    axis.title = element_text(size = 21),
    legend.text = element_text(size = 19),
    legend.title = element_text(size = 16, face = "bold"),
    legend.position = "bottom"
  )
The plot above corresponds to binary_log_model_2. Function binned_residuals() does the following:
Unless specified, the default number of bins is \(\lceil \sqrt{n} \rceil\) as in the ceiling function:
ceiling(sqrt(n)). For the datasetbreast_cancerwe have \(n = 569\), leading to 24 bins (i.e. 24 points in the plot).The \(n\) fitted values \(\hat{p}_i\) are ordered from smallest to largest.
The ordered fitted values \(\hat{p}_1 < \hat{p}_2 < \dots < \hat{p}_n\) are equally split in the \(\lceil \sqrt(n) \rceil\) bins.
The respective average fitted value per bin is mapped onto the \(x\)-axis.
The corresponding average raw residual \(\bar{r}_j\) for the \(j\)th bin is mapped on the \(y\)-axis. Recall the \(i\)th raw residual is \(r_i = y_i - \hat{p}_i\).
The 95% bounds of confidence are computed as \(\pm 1.96 \times \left( \frac{s_{r_j}}{\sqrt{n_j}} \right)\) centred at \(0\) on the \(y\)-axis; where \(s_{r_j}\) is the sample standard deviation of the raw residuals in the \(j\)th bin with \(n_j\) observations, and \(1.96\) is the \(97.5th\) percentile of the Standard Normal distribution.
One would expect to have \(95\%\) of the points to be within the bounds to have a good model fit. We can check this via the below code on column
groupindiagnostic_bins.
prop.table(table(as.factor(diagnostic_bins$group)))
       no       yes
0.5416667 0.4583333
Therefore, using a binned residual plot for binary_log_model_2, we can conclude this model is not a good fit for our training data since only 45.85% of the points in the above plot are within the bounds.

